.png)
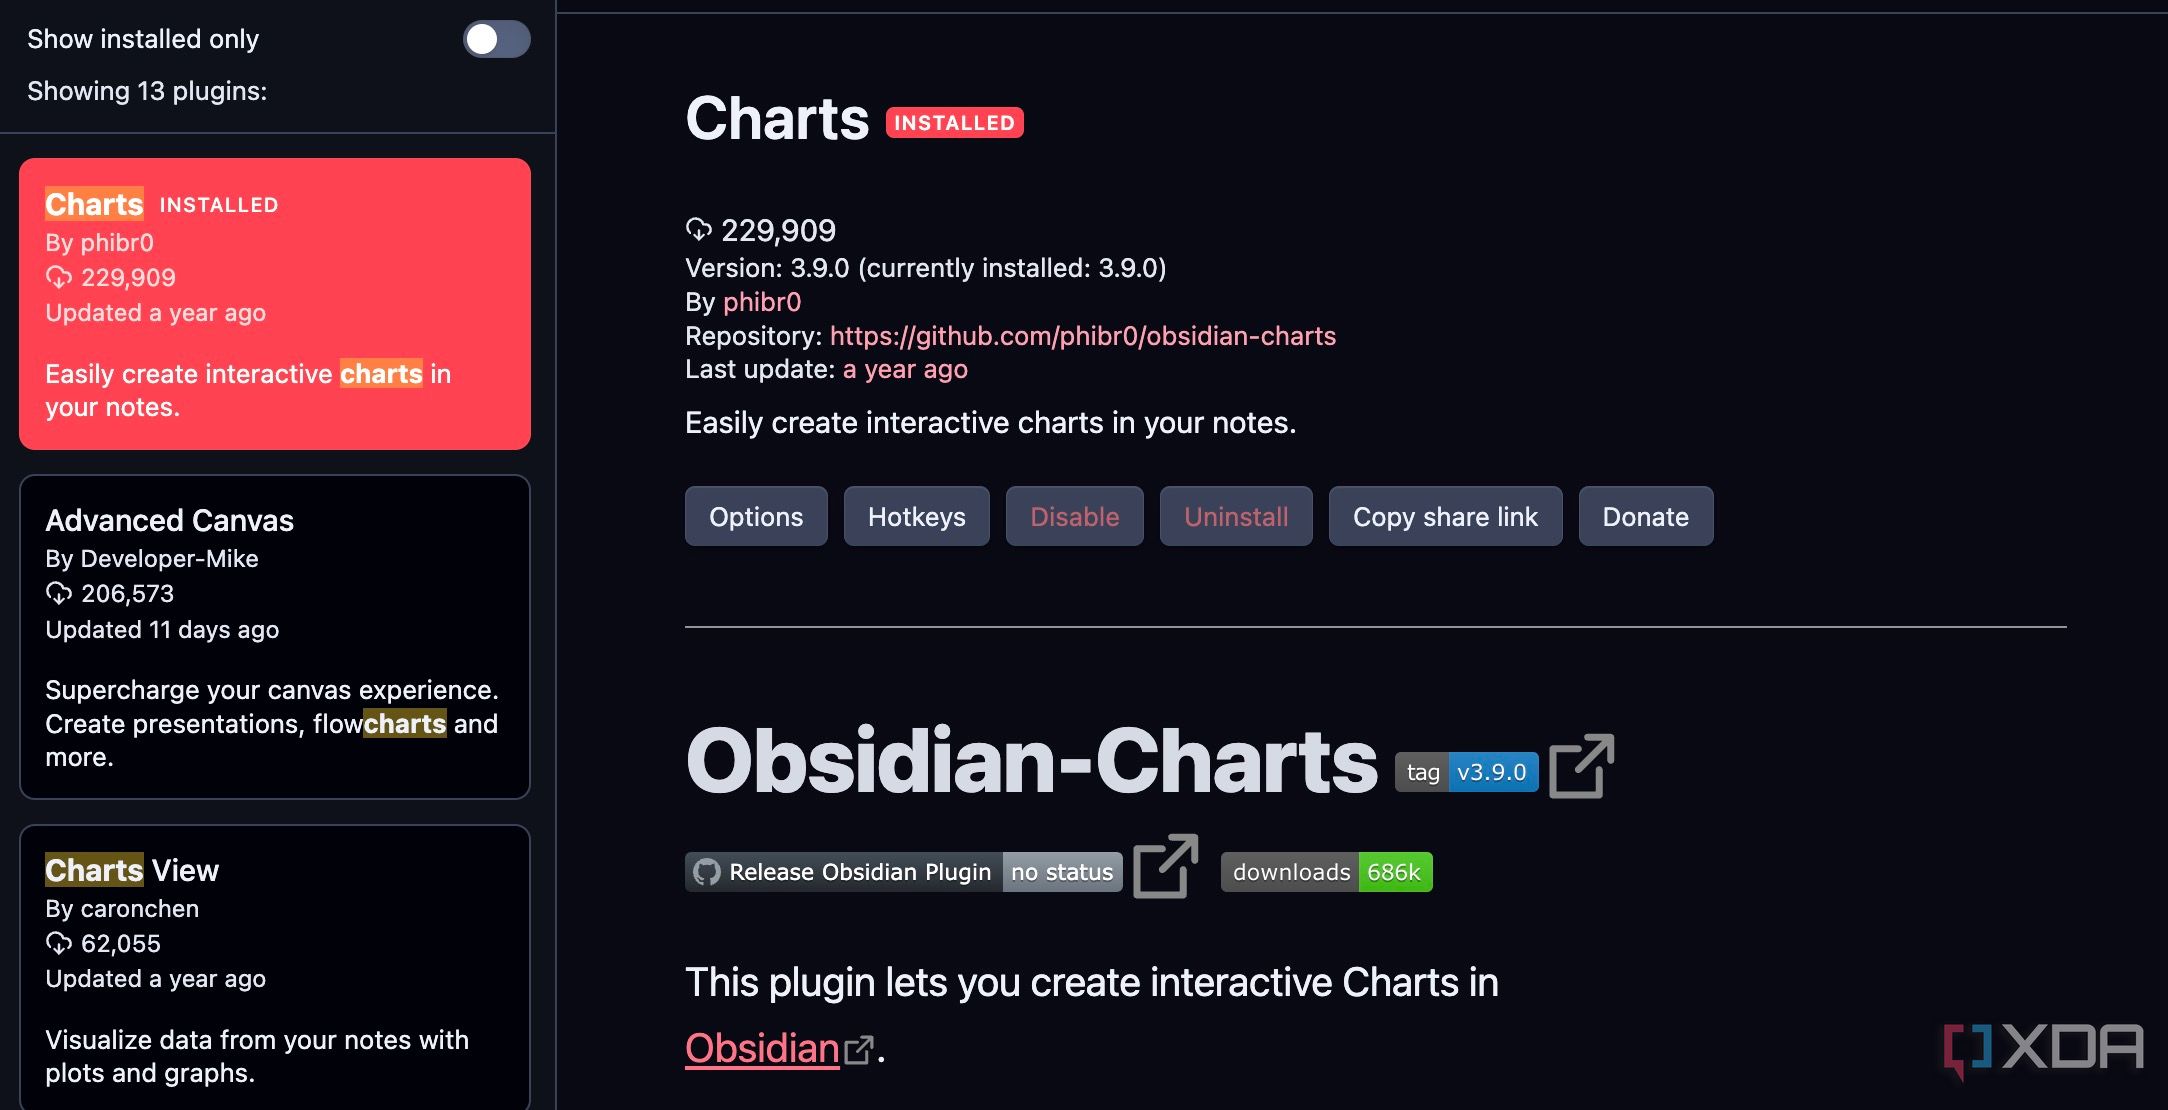
Visualizing data can significantly enhance the clarity and impact of your notes. Being a Markdown-first editor, Obsidian doesn’t support charts by default. That’s where its rich plugin community comes into play. Charts is one such plugin that enables a wide variety of editable, interactive, and animated charts within your Obsidian vault.
If you have ever wished you could turn those numbers and trends into interactive graphs right inside Obsidian, this is it. Built on the fantastic Chart.js library, this plugin lets you create all sorts of charts without ever leaving your notes. Let’s check it in action.

Related
The desire for data visualization in Obsidian

We all accumulate data within our Obsidian vaults, whether it's tracking habits, project timelines, research findings, or even personal finances. Often, this data exists as lists, tables, or embedded numbers within our notes. Sometimes, these text-based representations can lack the immediate impact and clarity. Wouldn't it be powerful to move beyond static numbers and bring your data to life?
You can always move your data into an Excel sheet, generate charts, and download them as images. Instead of such a tedious manual method, use the trick below to get the job done.
Install the Charts plugin
As mentioned earlier, Charts is a third-party plugin. Obsidian blocks such plugins by default for obvious reasons. You need to disable the restricted mode first to enable the plugin store for your vault. Here’s how.
- Launch your Obsidian vault and head to Settings.
- Scroll to Community Plugins.
-
Click Turn off and reload beside the Restricted mode menu.

- Once your vault reloads, click Browse beside Community plugins and search for Charts from the following menu.
-
Select Install and enable the plugin from the same menu.
You are all set to use charts within your vaults.
Charts plugin in action
Once you enable Charts plugin, it’s time to check it in action. In your Obsidian note where you want to add the chart, start a code block by typing three backticks (```) followed by chart and then press Enter. This tells Obsidian that the content within this code block should be interpreted by the Charts plugin.
Inside the chart code block, you'll define the configuration for your chart in YAML format. This includes the type of chart, the data, and various options for customization.
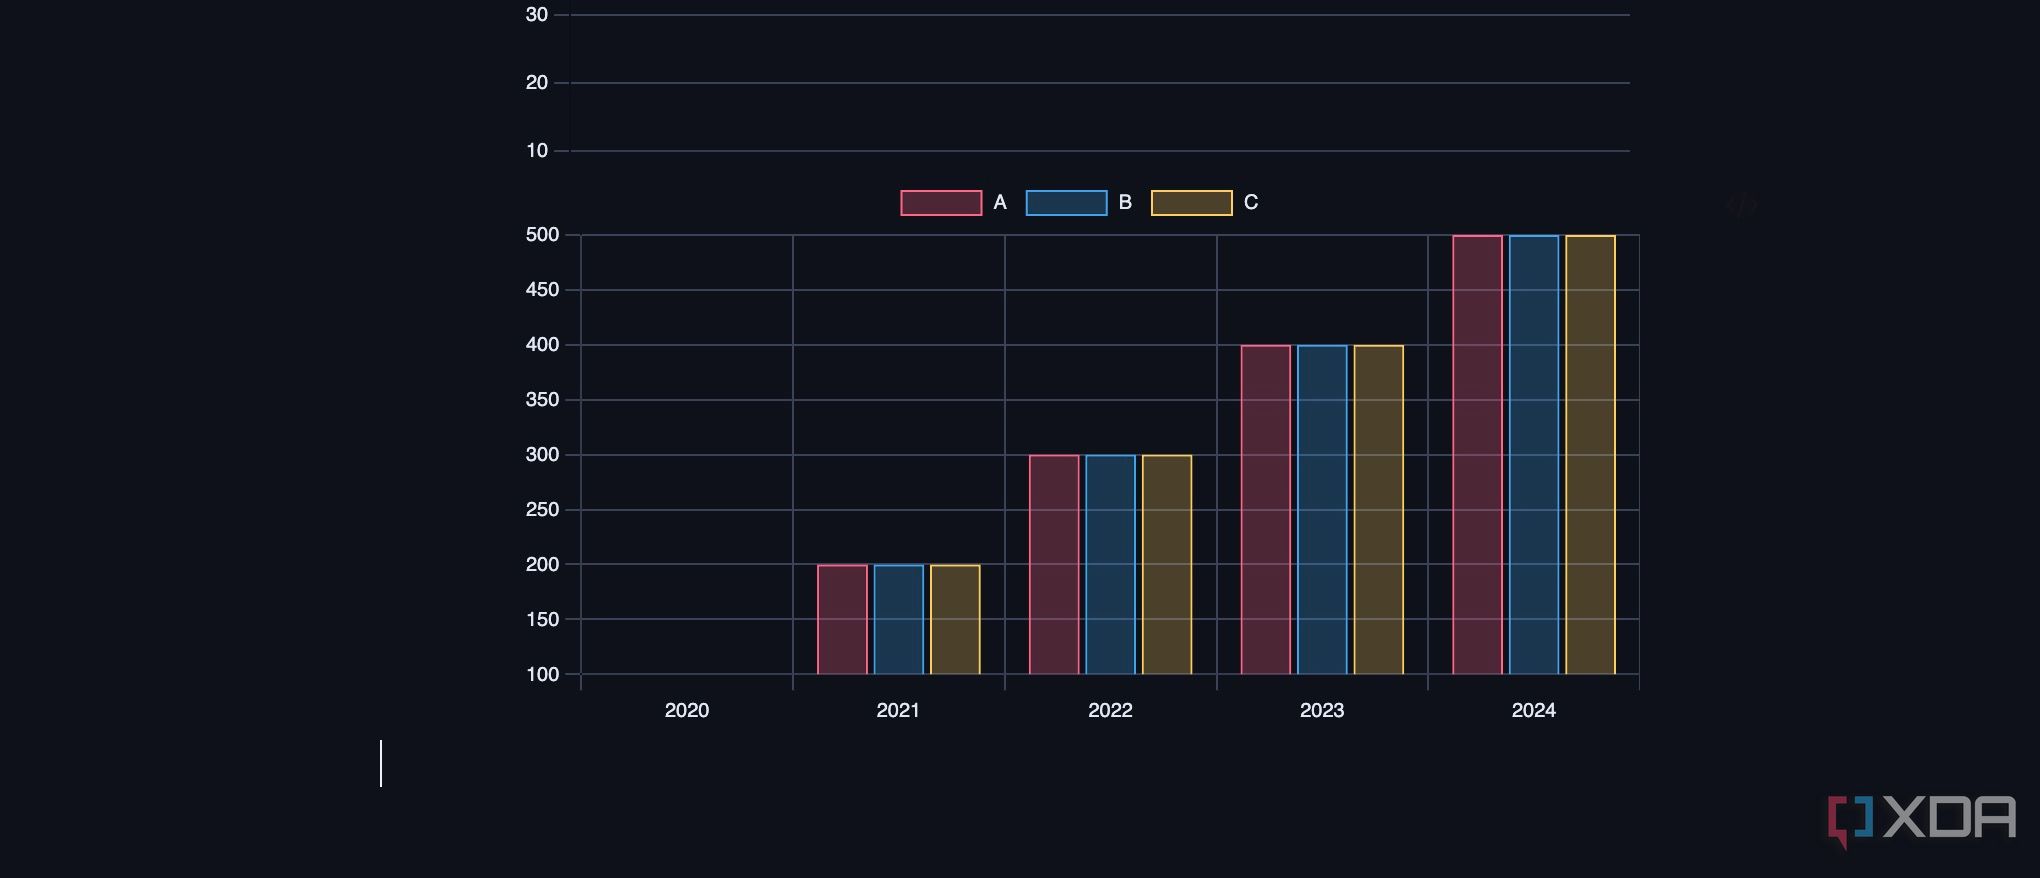
Suppose you are tracking the annual sales (in thousands of dollars) of three different product lines (A, B, and C) for your small business from 2020 to 2024. You want to visualize their performance over these years using a bar chart in your Obsidian notes.
- Create a new note in Obsidian.
-
Insert a code block.
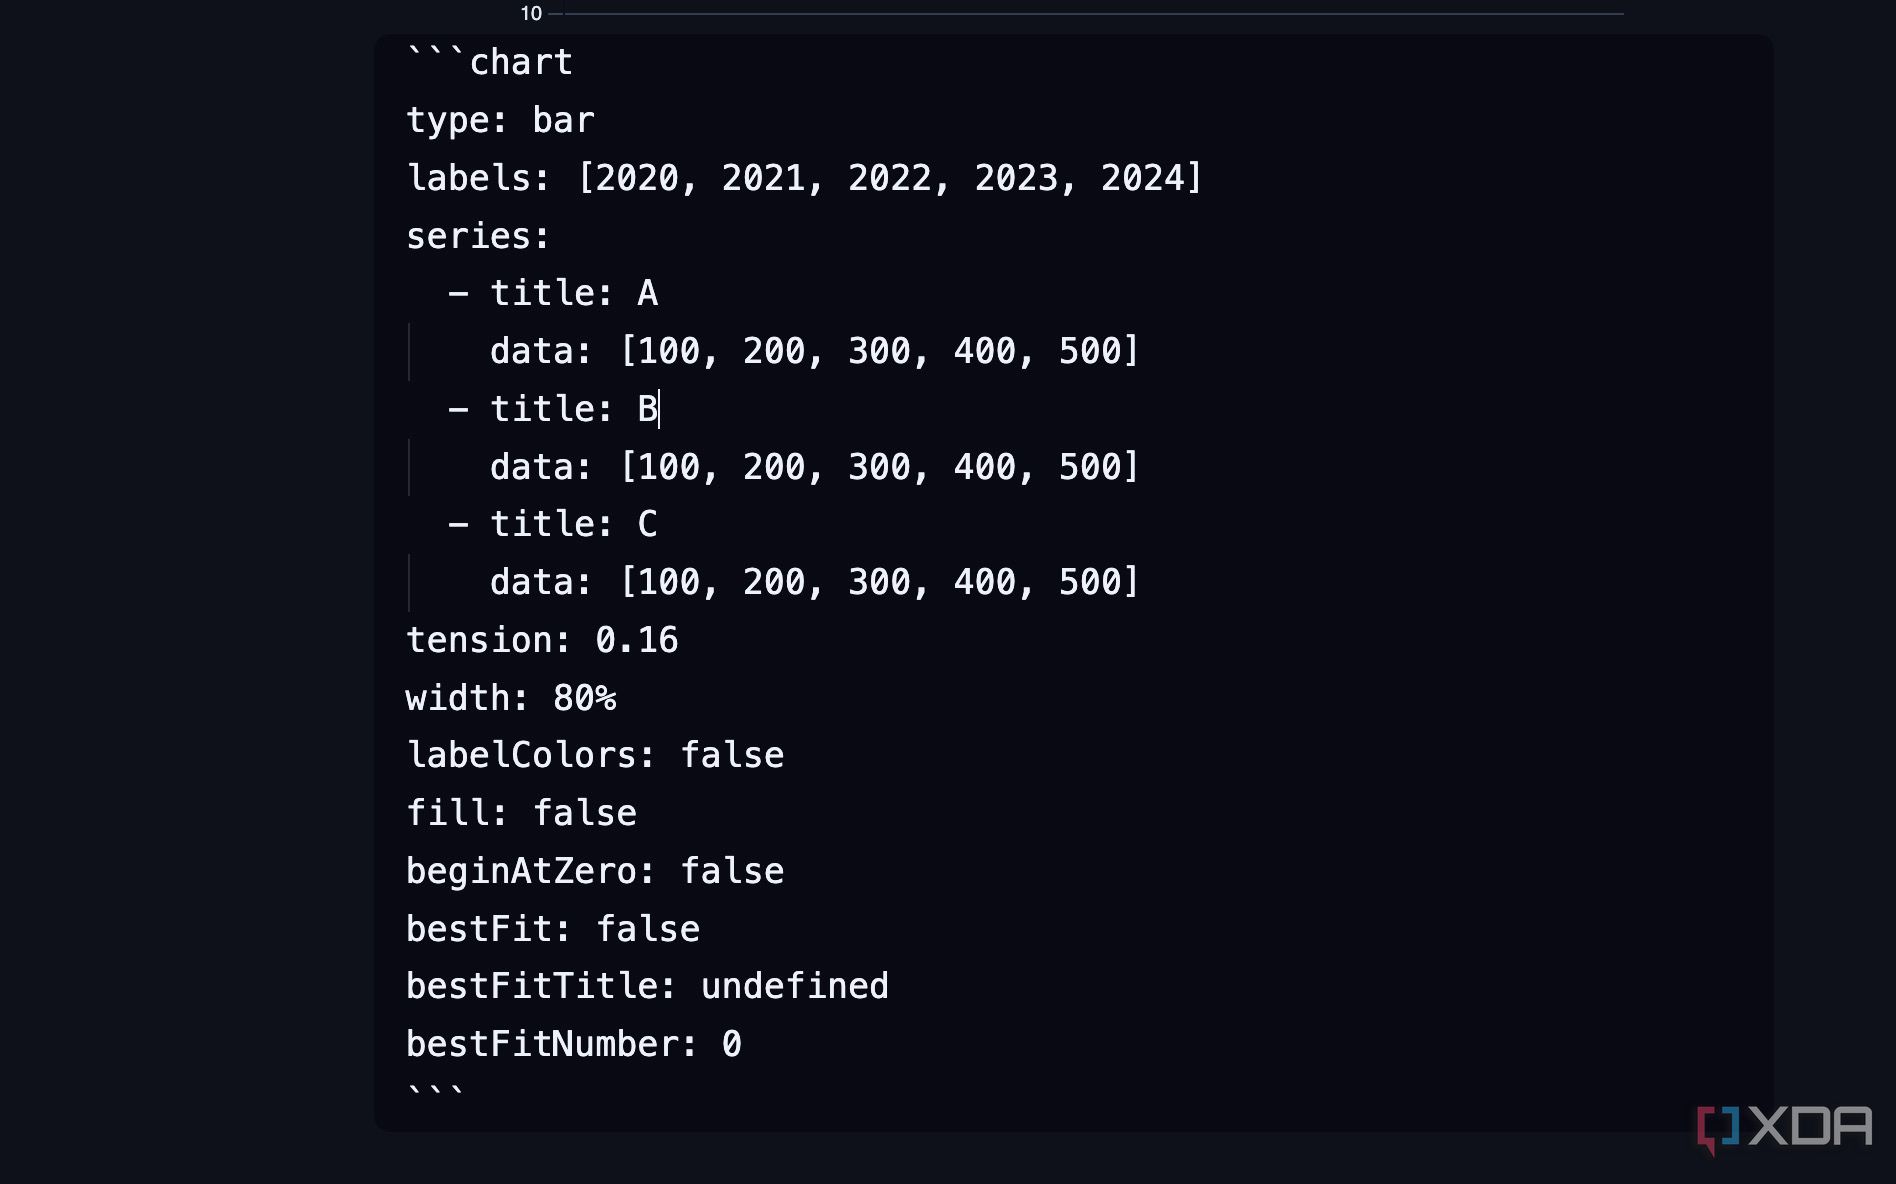
- Define the Chart Configuration.
```chart
type: bar
labels: [2020, 2021, 2022, 2023, 2024]
series:
- title: A
data: [100, 200, 300, 400, 500]
- title: B
data: [100, 200, 300, 400, 500]
- title: C
data: [100, 200, 300, 400, 500]
tension: 0.16
width: 80%
labelColors: false
fill: false
beginAtZero: false
bestFit: false
bestFitTitle: undefined
bestFitNumber: 0
```
Close the code block, and your chart is ready to use.
Now, not everyone is familiar with such language to create charts in Obsidian. Thankfully, there is another simple way to get the job done.
- Create a new note in Obsidian.
-
Type /chart and create a new chart.
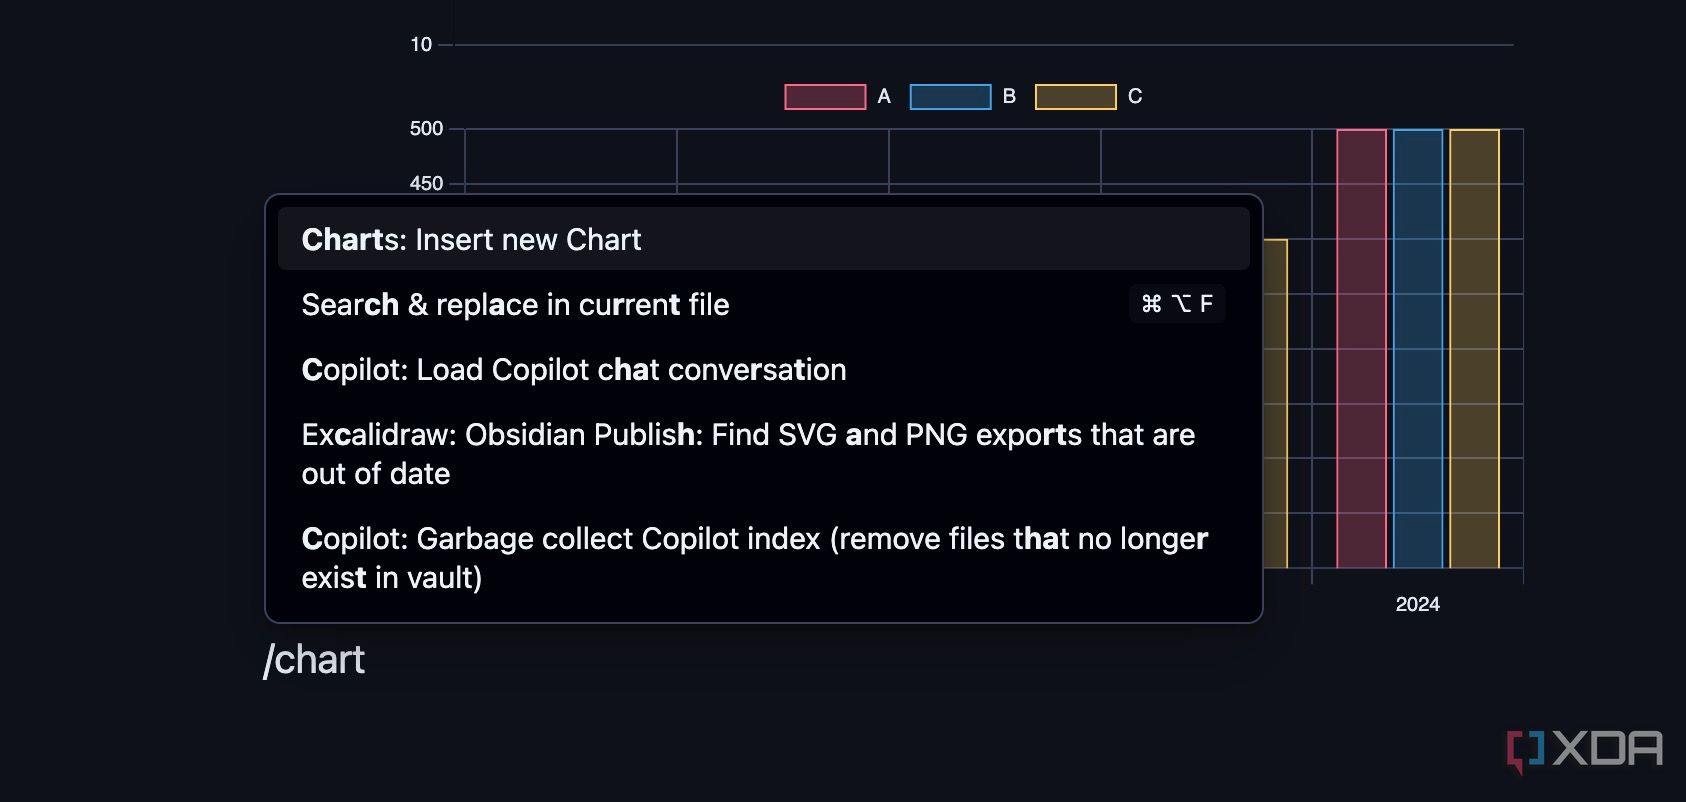
- It opens a new menu to create a new chart.
-
Enter relevant details like chart type, smoothness, width, X-axis, and Y-axis data, and click Insert chart.
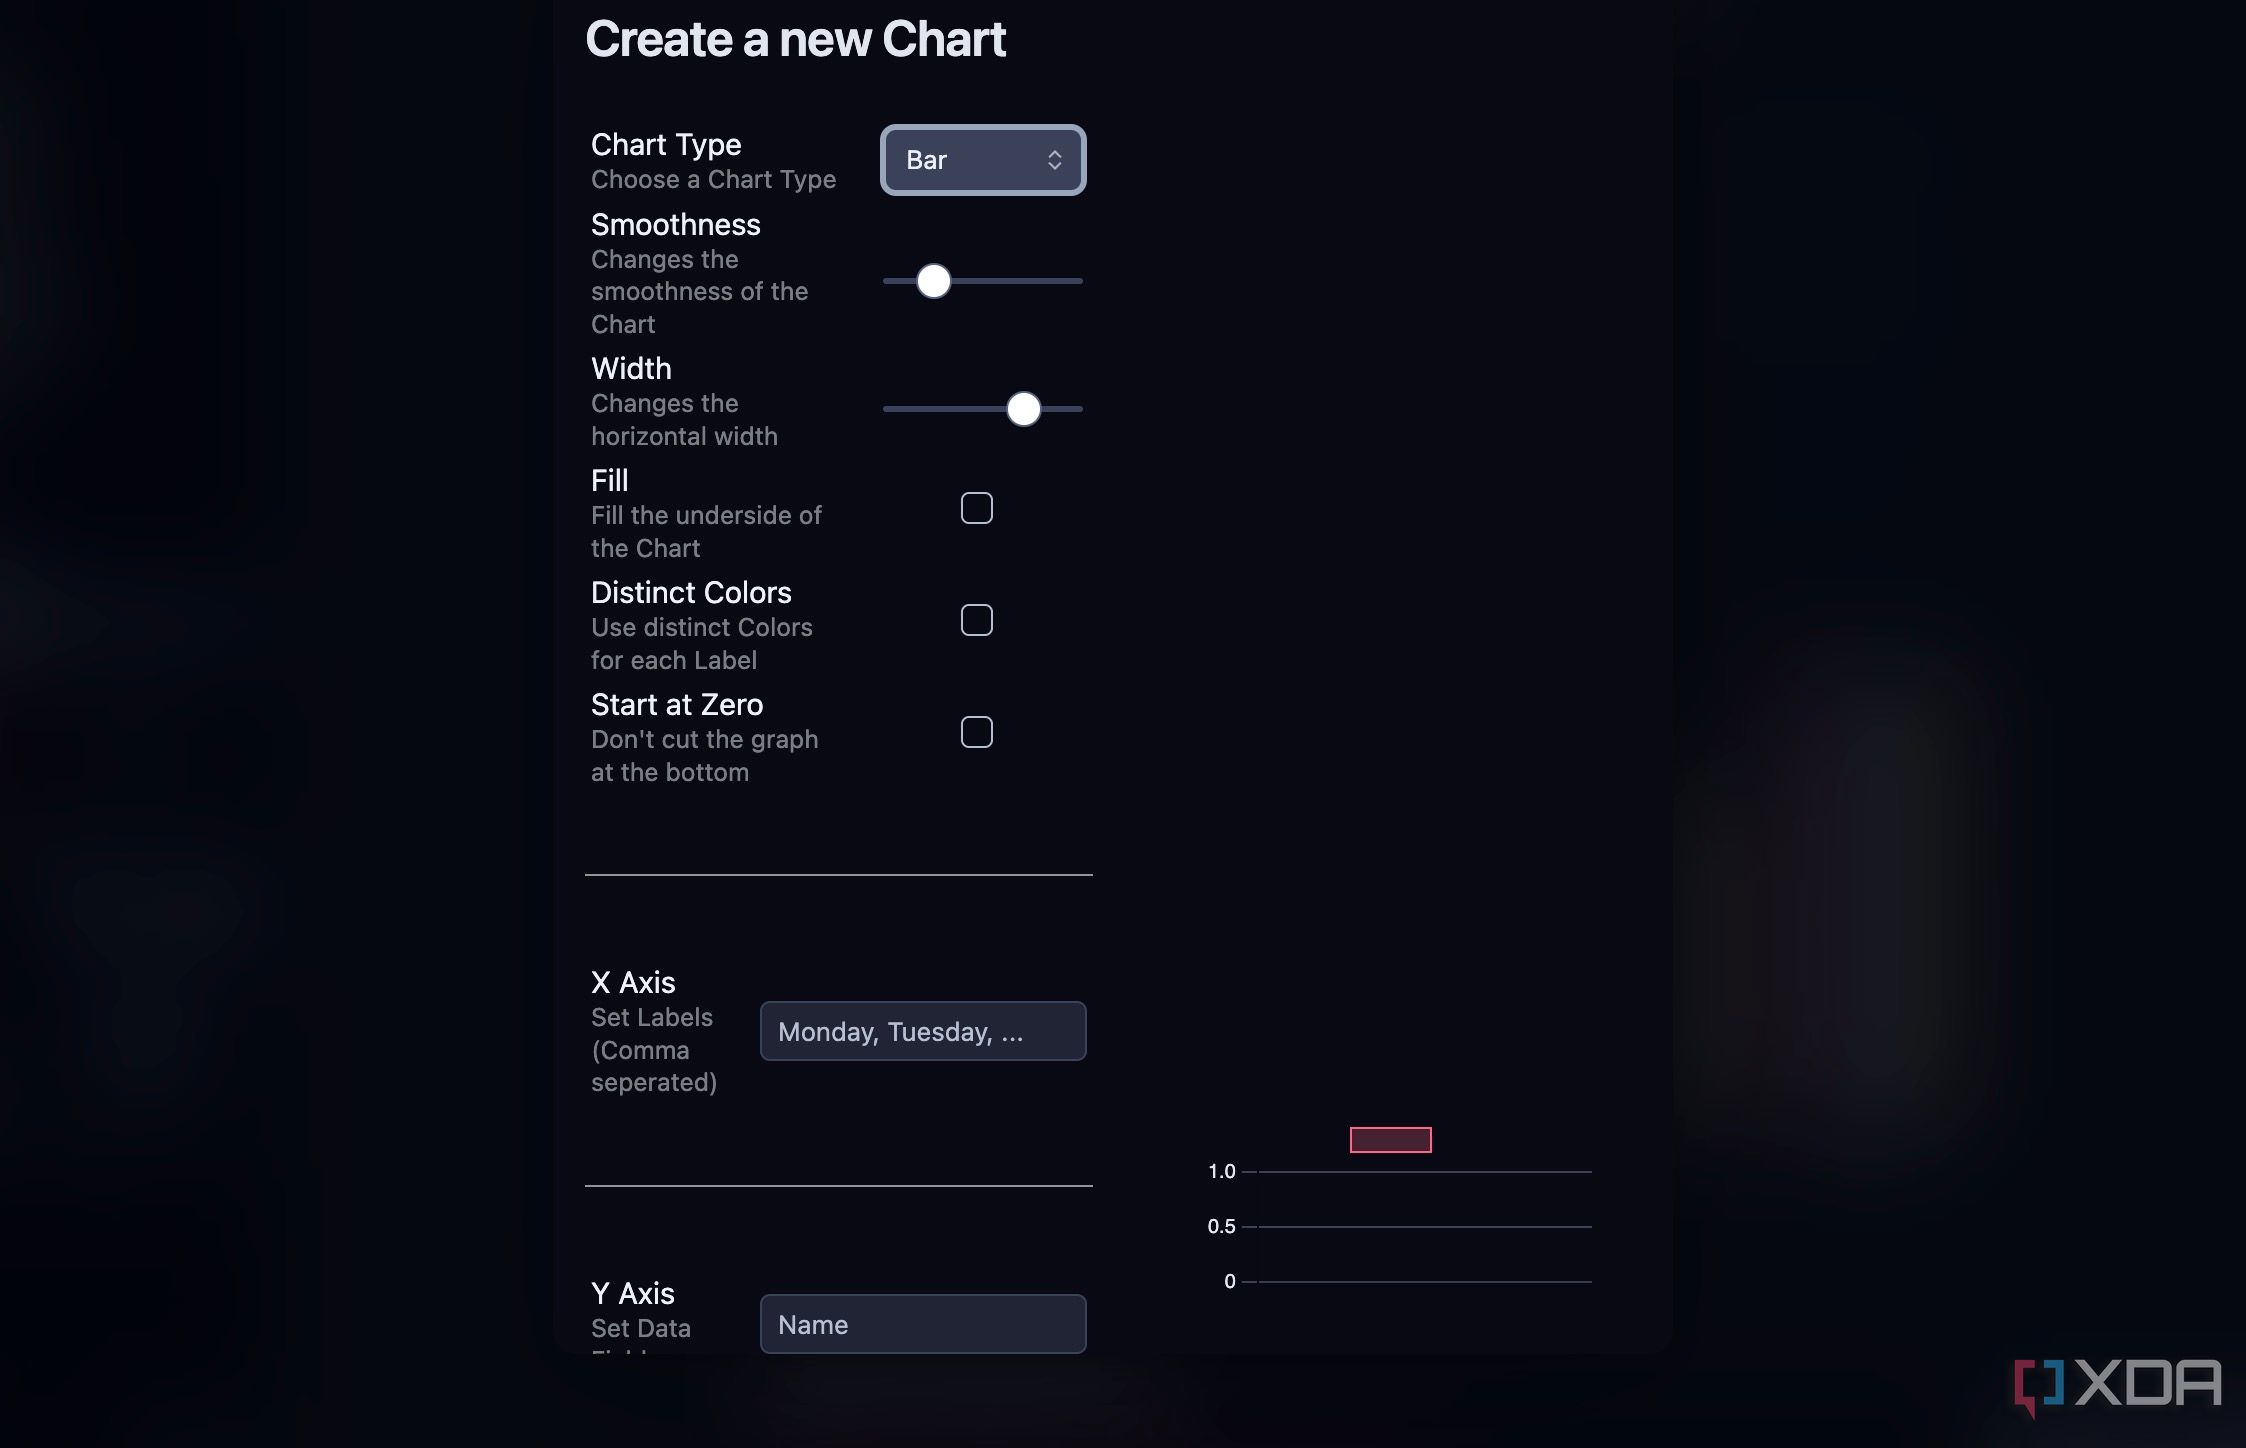
The Charts plugin automatically generates the required code and displays the chart. The plugin supports Bar, Line, Pie, Radar, Polar Area, and Doughnut charts. These should be good enough for multiple use cases.
You can also generate a chart from a table. Here, you need to add block ID (^name) to your table and add the same to your chart codeblock. And if you want to link a table from a different file, make sure to include the Filename in the file attribute.
Explore the customization options
The Charts plugin is packed with a range of customization options. You can head to Settings and scroll to the Charts plugin. You can tweak colors for charts and image format from PNG to JPG or WEBP and change its quality.
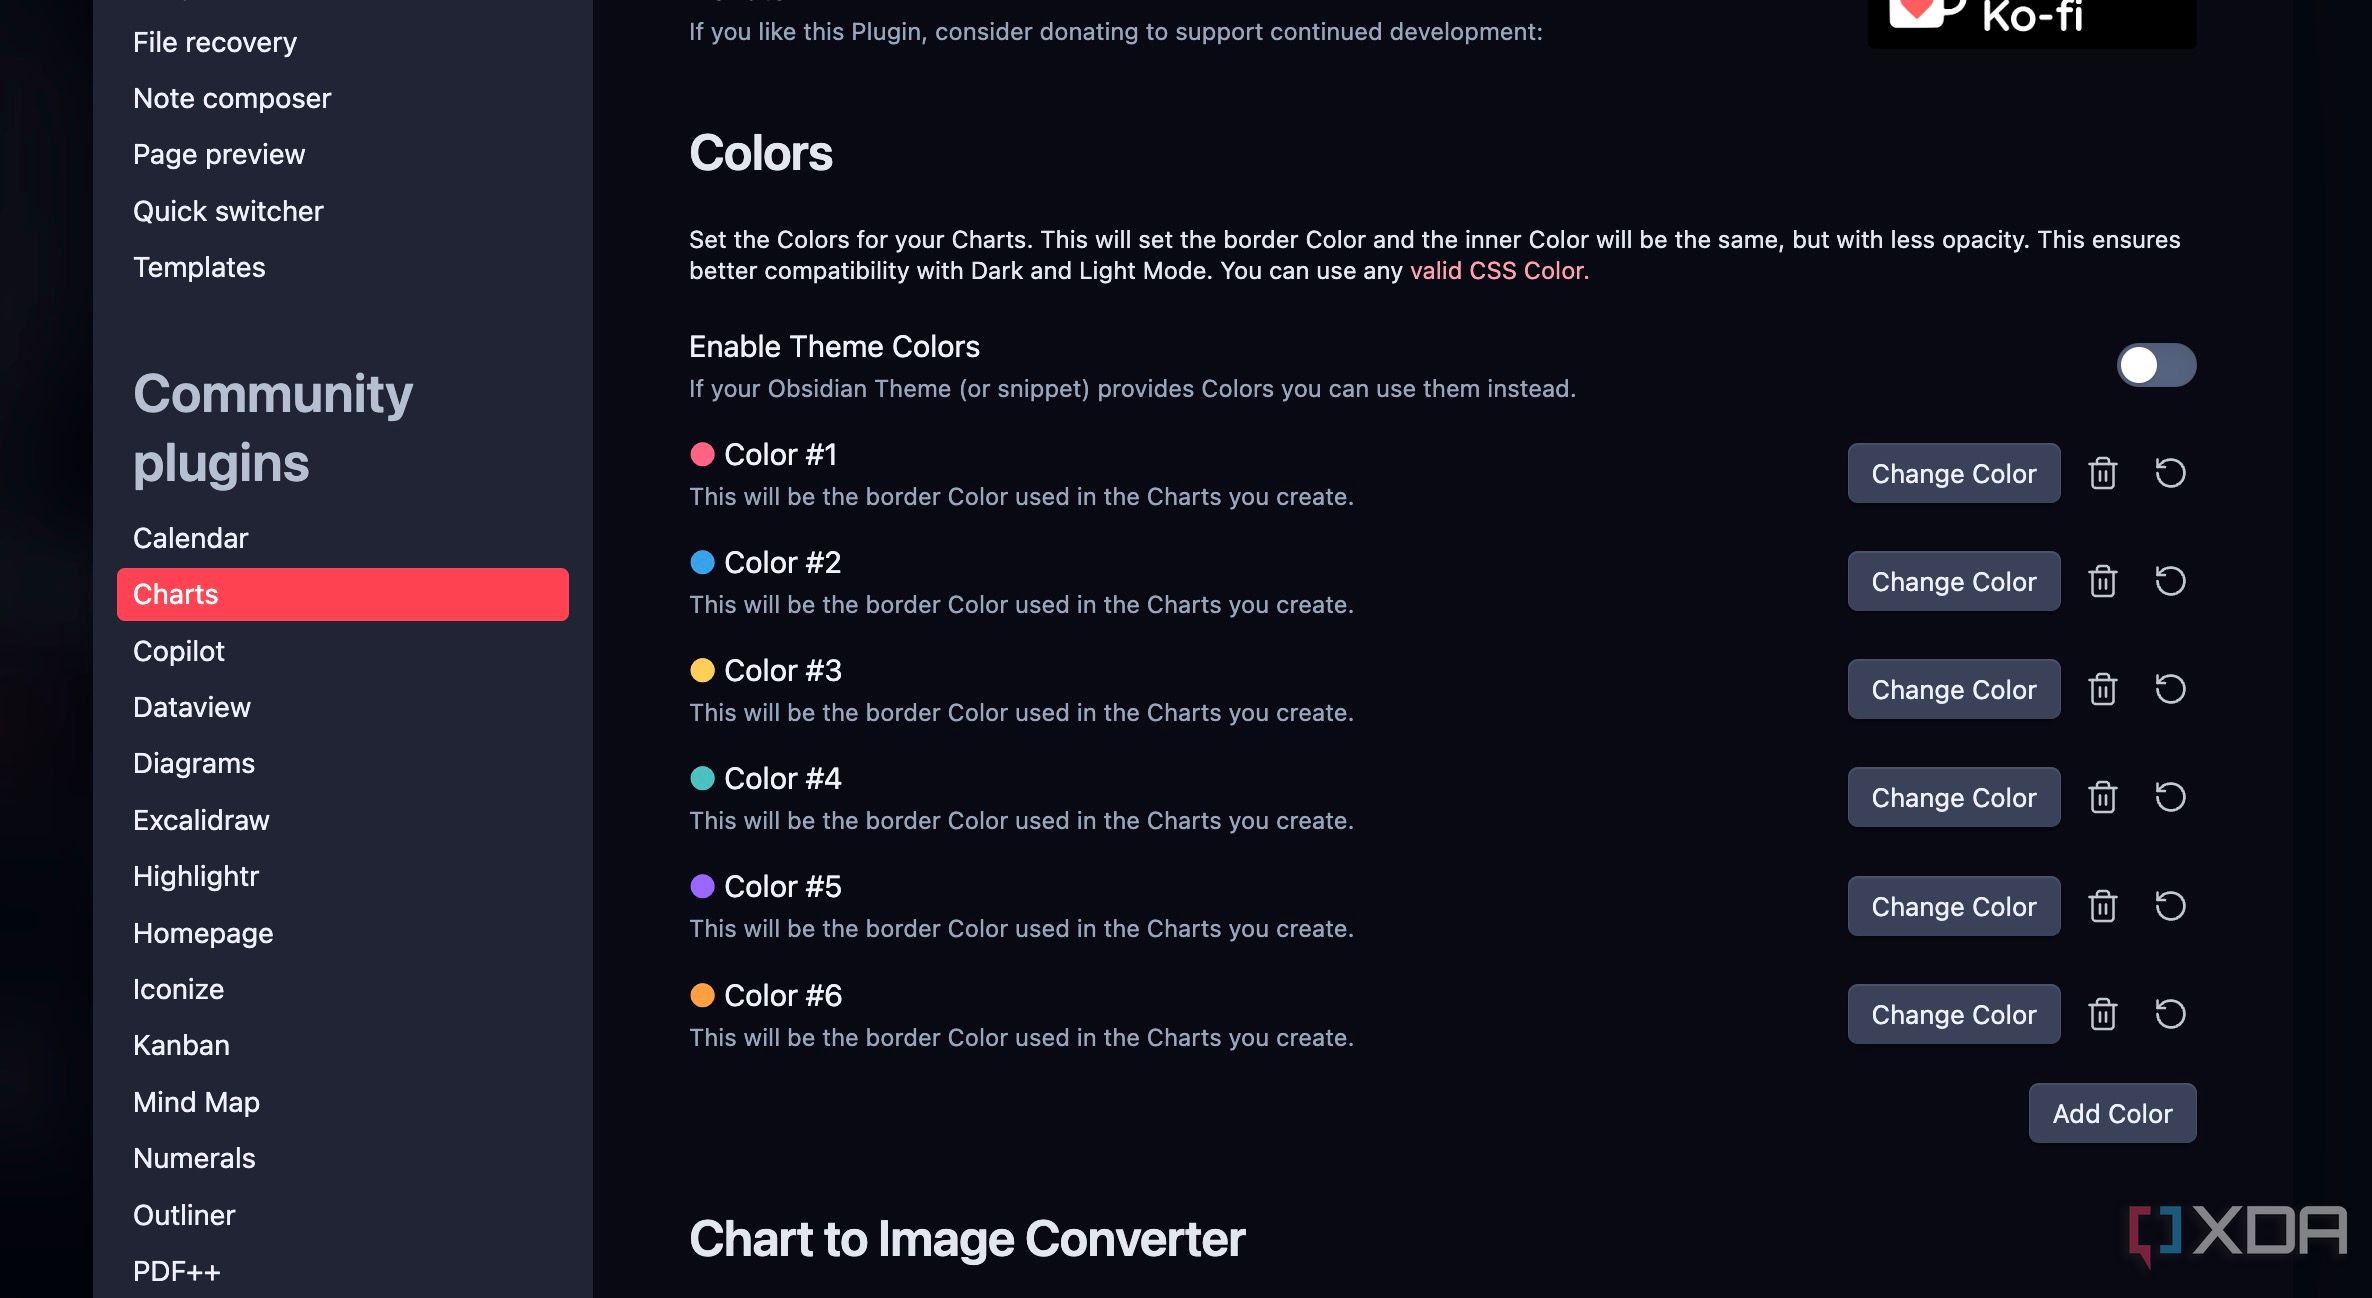
There is also an option to enable theme colors, where the plugin uses colors provided by your Obsidian theme. The Charts plugin in Obsidian opens up a wealth of practical use cases. For example, you can visualize your progress on daily or weekly habits (e.g., exercise, writing, meditation). A bar chart showing completed days or a line chart tracking the duration of the habit can be very motivating.
You can use it for sleep analysis, basic finances, project progress, goal tracking, and time blocking analysis.
Related
Mermaid is the best Obsidian feature you didn't know about
Visualize your thinking using mermaid diagrams in Obsidian
Stop guessing, start visualizing
So there you have it – a straightforward way to bring the power of data visualization into your work and personal vaults. From simple bar graphs to dynamic line charts, the possibilities are endless here. I highly recommend you to explore this plugin. The installation process is quick and easy through Obsidian's Community Plugins. Take a few moments to install and experiment with creating your own charts.
Meanwhile, check out my dedicated guide if you are looking to give your Obsidian vault an aesthetic makeover.


 English (US) ·