.png)
Data collection without analysis is a waste of time. Analyzing your data is the only way to uncover fresh insights and get valuable information about the population your sample represents. Facts must be extracted after administering questionnaires, and researchers use various statistical tools and techniques when trying to do this. I prefer the easier route: SPSS. It is great for analyzing survey data, since it does not require coding or any special syntax. The point-and-click interface makes things easy; even researchers with no prior experience can quickly learn to analyze surveys with SPSS and bring out valuable facts from figures. Regardless of whether you've distributed a questionnaire virtually or physically, the same method could be employed to analyze respondents' data. In this guide, I'll show you a step-by-step process for analyzing answers obtained after administering survey questionnaires.

Related
Handling SPSS Variable View
Creating variable names with survey questions
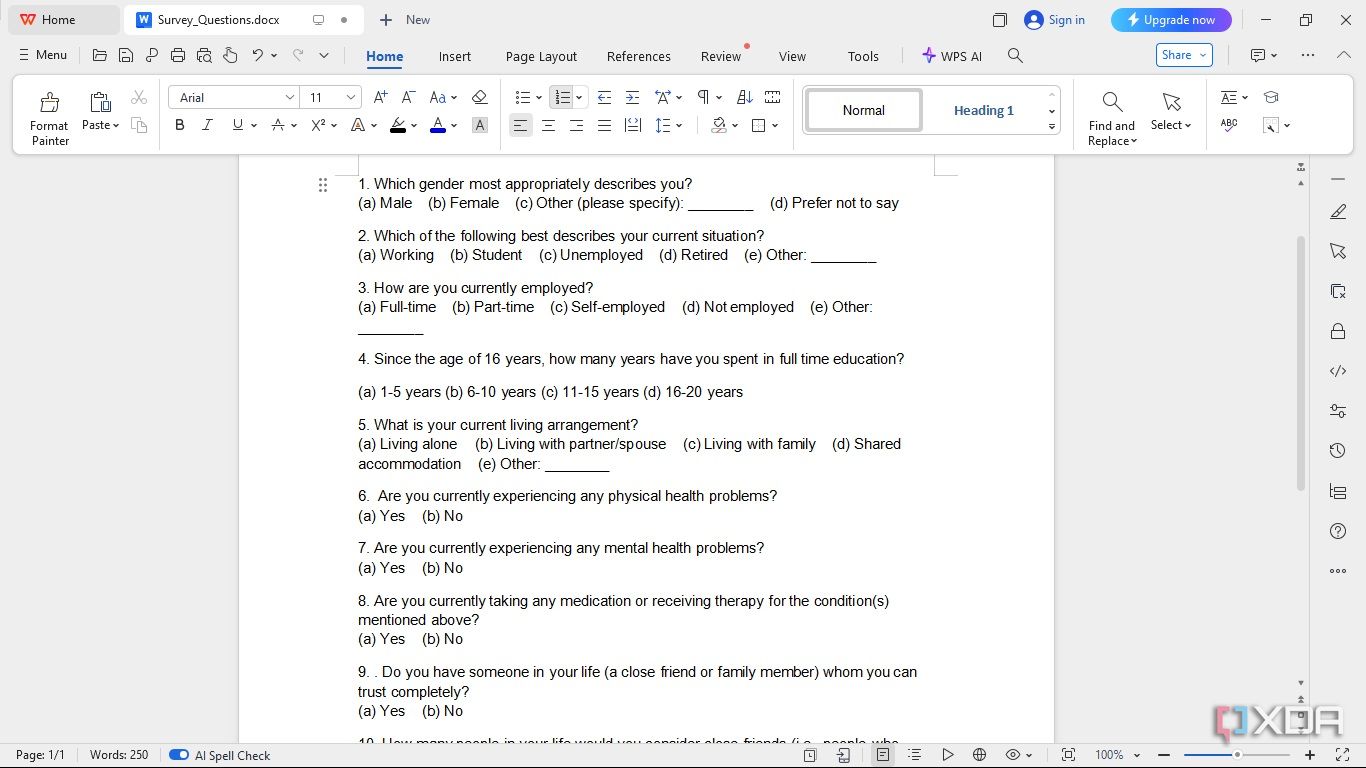
If you are new to SPSS, figuring out how each survey question will be imputed into the variable tab might be difficult. However, it's quite simple. Let's assume you have the questions in the screenshot above to analyze. Here's how you can go about it. Let's use question four as an example.
-
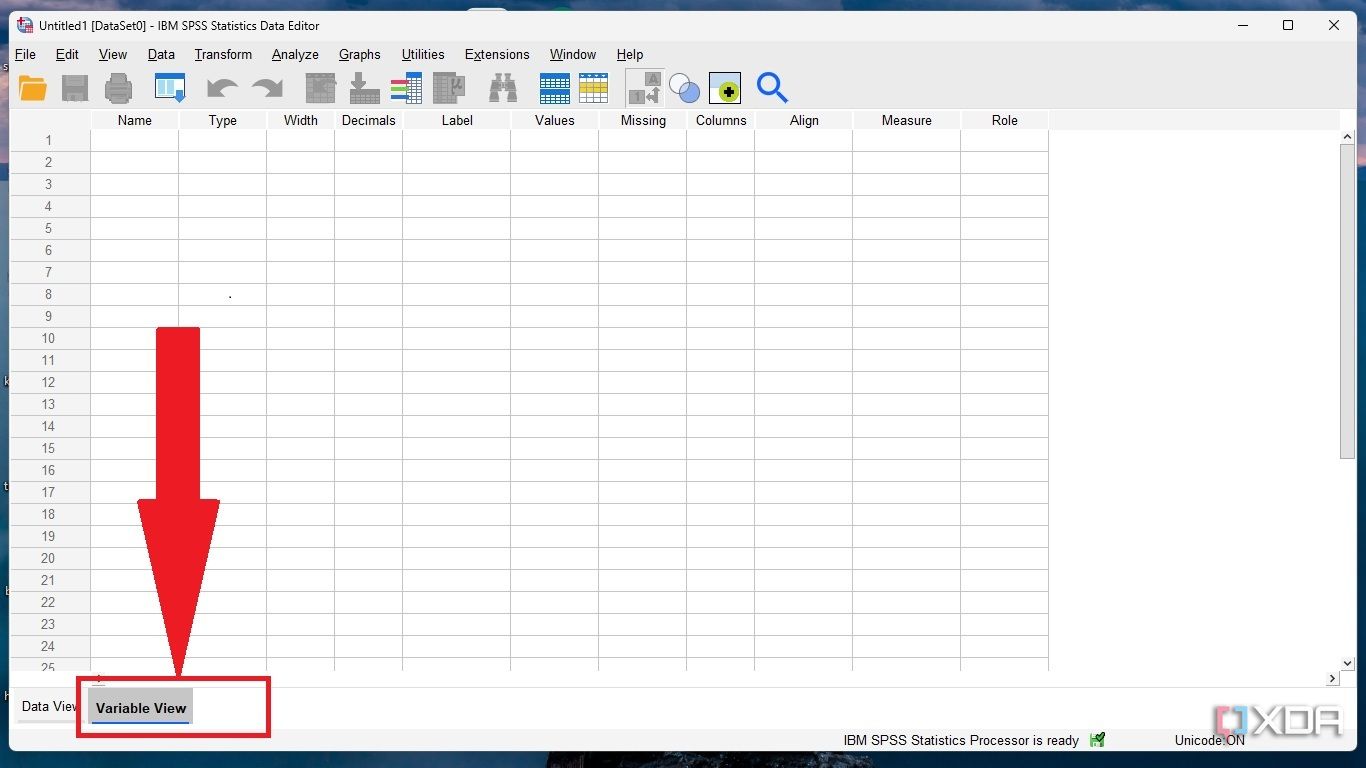
Start by opening your SPSS app and clicking the Variable View tab.
-
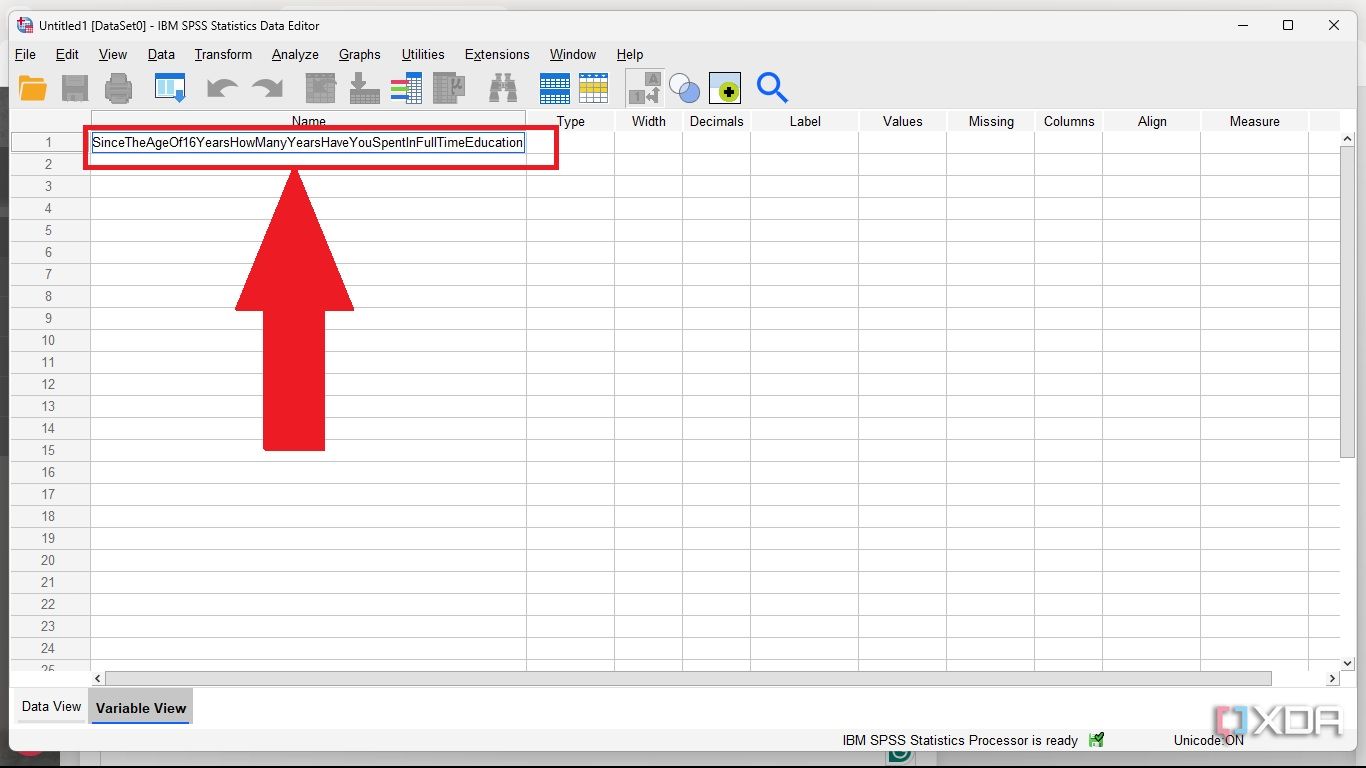
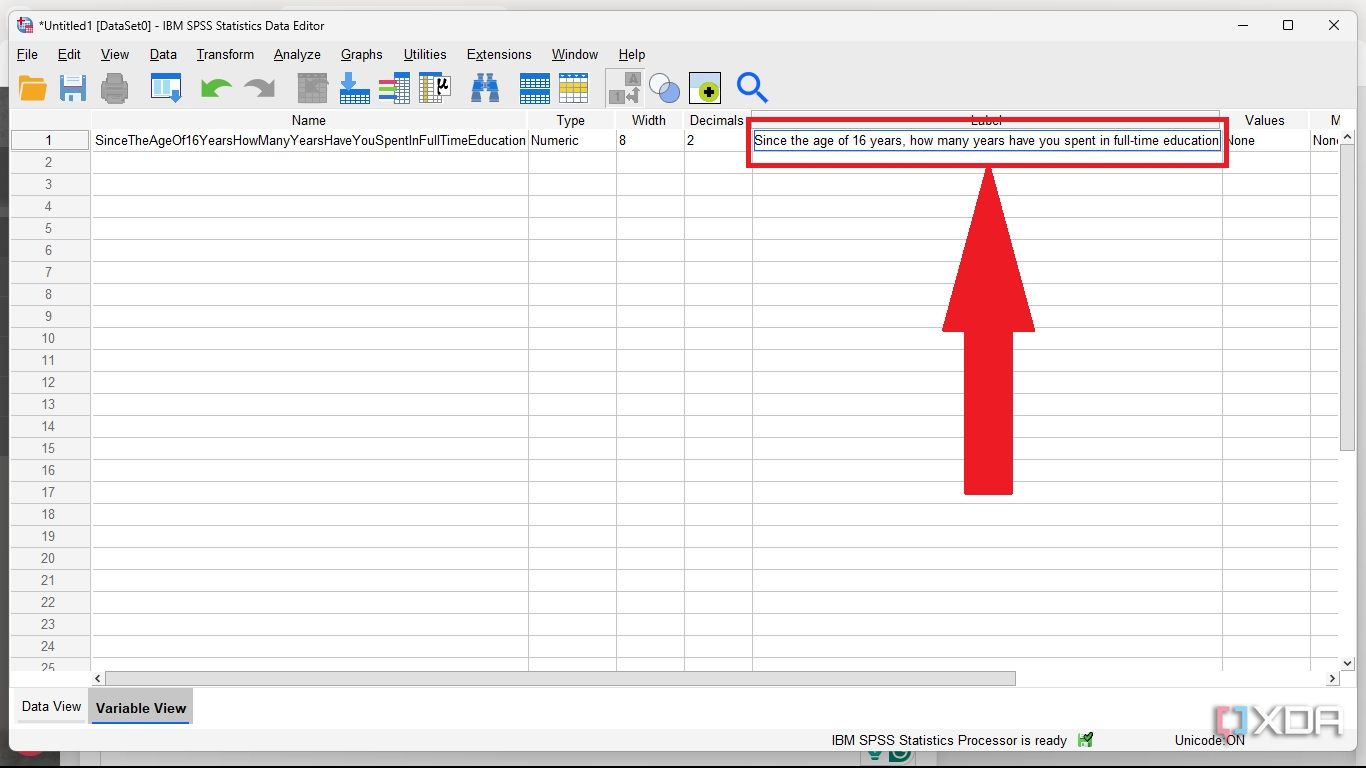
Rewrite the question in the variable name text field. Write in PascalCase(SinceTheAgeOf16YearsHowManyYearsHaveYouSpentInFullTimeEducation) to avoid hindrance from SPSS restrictions on variable names.
-
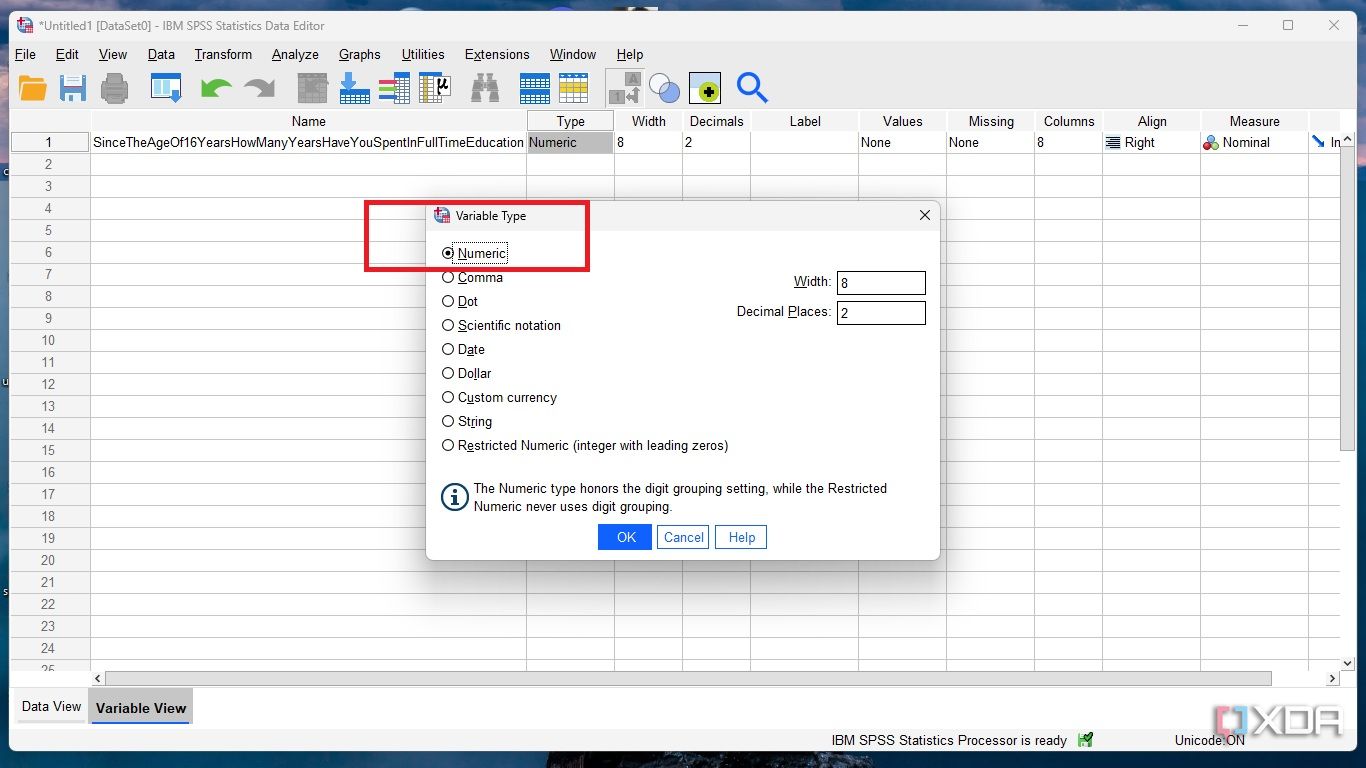
Choose Numeric as variable type and ignore the next two fields, width and decimal.
-
Copy and paste the question as a label: "Since the age of 16 years, how many years have you spent in full-time education?"
-
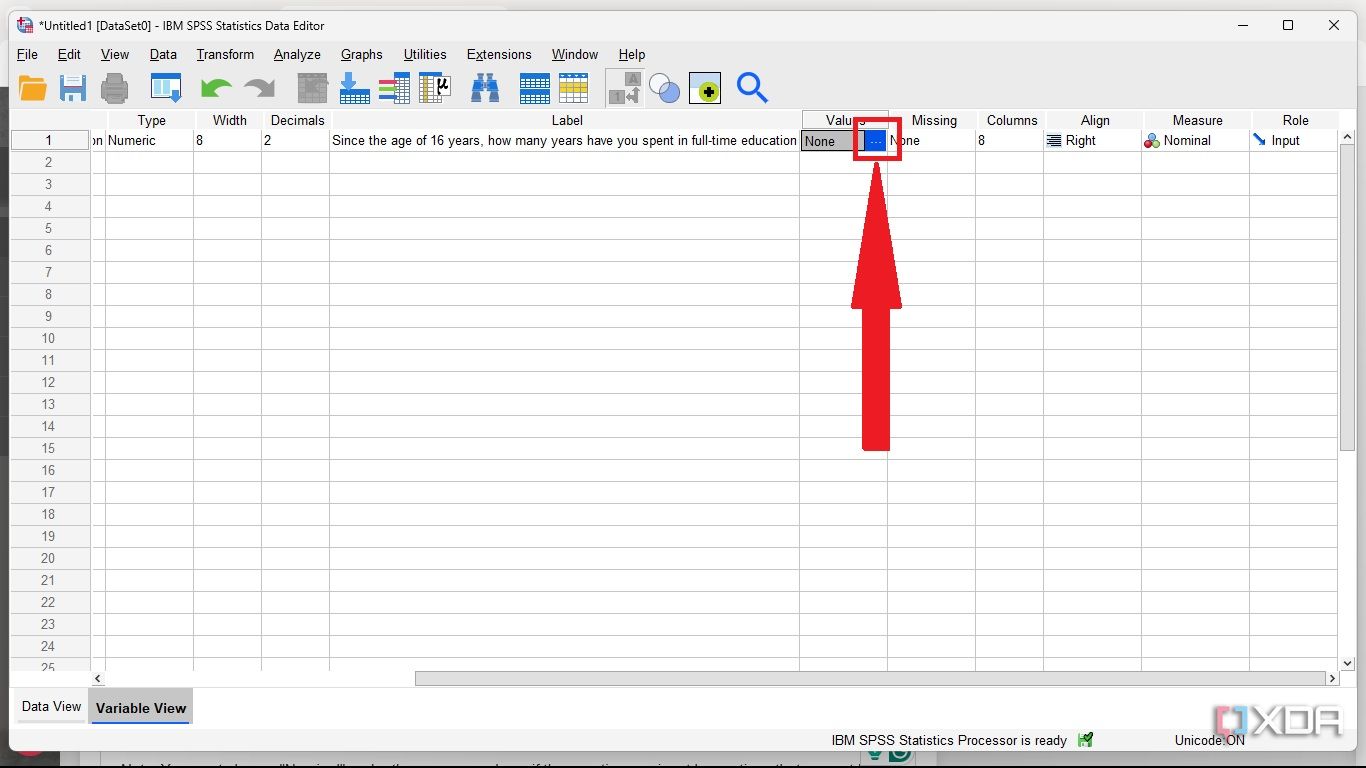
Next, click the three dots in the values field.
-
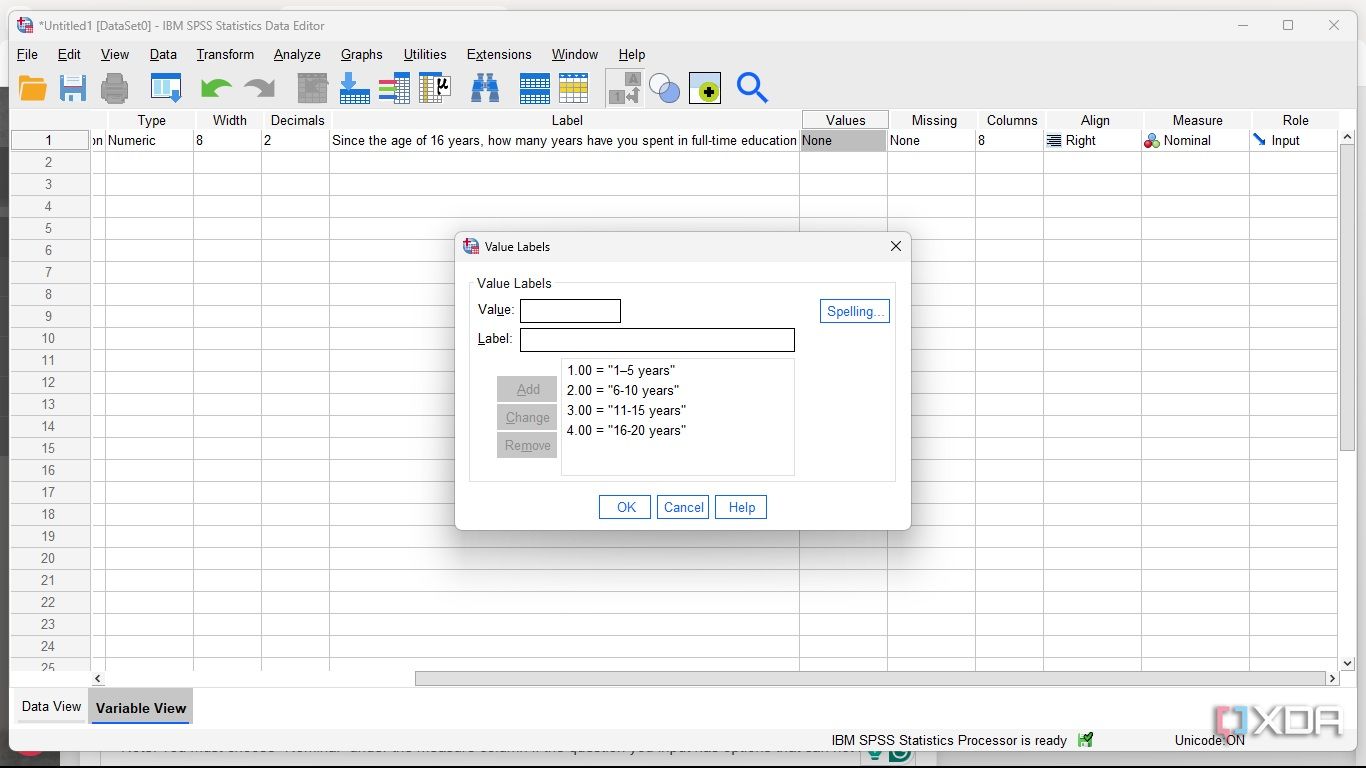
To input your values, assign 1 to 1–5 years, 2 to 6–10 years, 3 to 11–15 years, and 4 to 16–20 years.
-
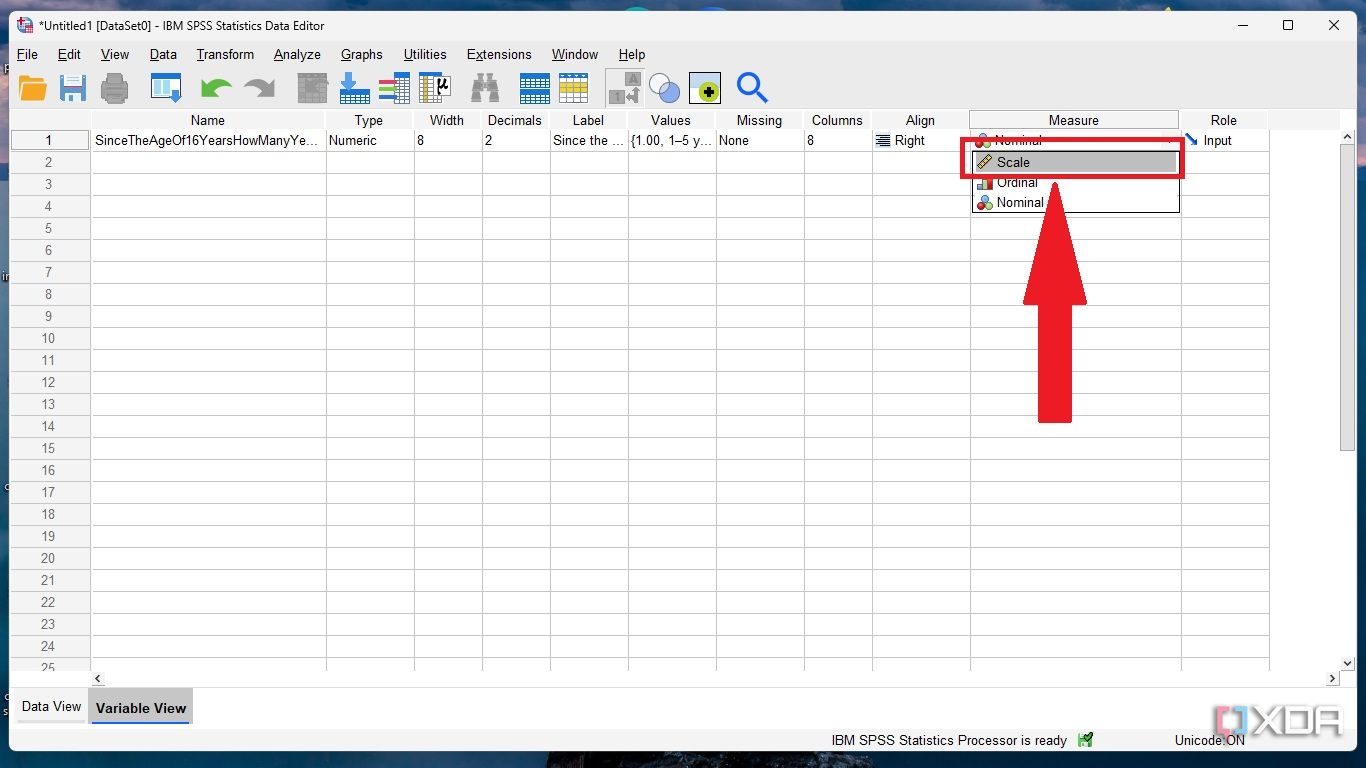
Thereafter, choose the right measure from the three options: Nominal, Ordinal, and Scale. In this case, I'm picking Scale because the options presented with the questions can be ranked.
By replicating the steps above, you can convert each question to SPSS variables. Once you have done this, you can input respondents' responses into the data view.
You must choose "Nominal" under the measure column if the question you input has options that can not be ranked. An example is a question with a yes and no option.
Handling SPSS Data View
Inputting survey responses
Remember that each option chosen by respondents now has a corresponding numerical value. Input the numerical value assigned to the survey responses into the data view tab from left to right. This will probably take a long time to complete, depending on the number of respondents. However, carefully completing this process will give you a very organized view of the data. You can use the 1-A feature at the top bar to check what each numerical value represents without manually converting numerical values into respondents' answers.
The stage is set for analysis with all questions now converted into SPSS variables and respondents' data entered into the SPSS data view. What next? Point and click. I'd recommend the following tools to give insight into your audience's responses. Let's start with descriptive statistics.
If your sample size is large, assigning and inputting respondents' responses may be time-consuming, as you will have to input respondents' answers for each question. However, automating the process with any generative AI tools may help to make it easier.
Descriptive statistics.
Creating a Frequency Table
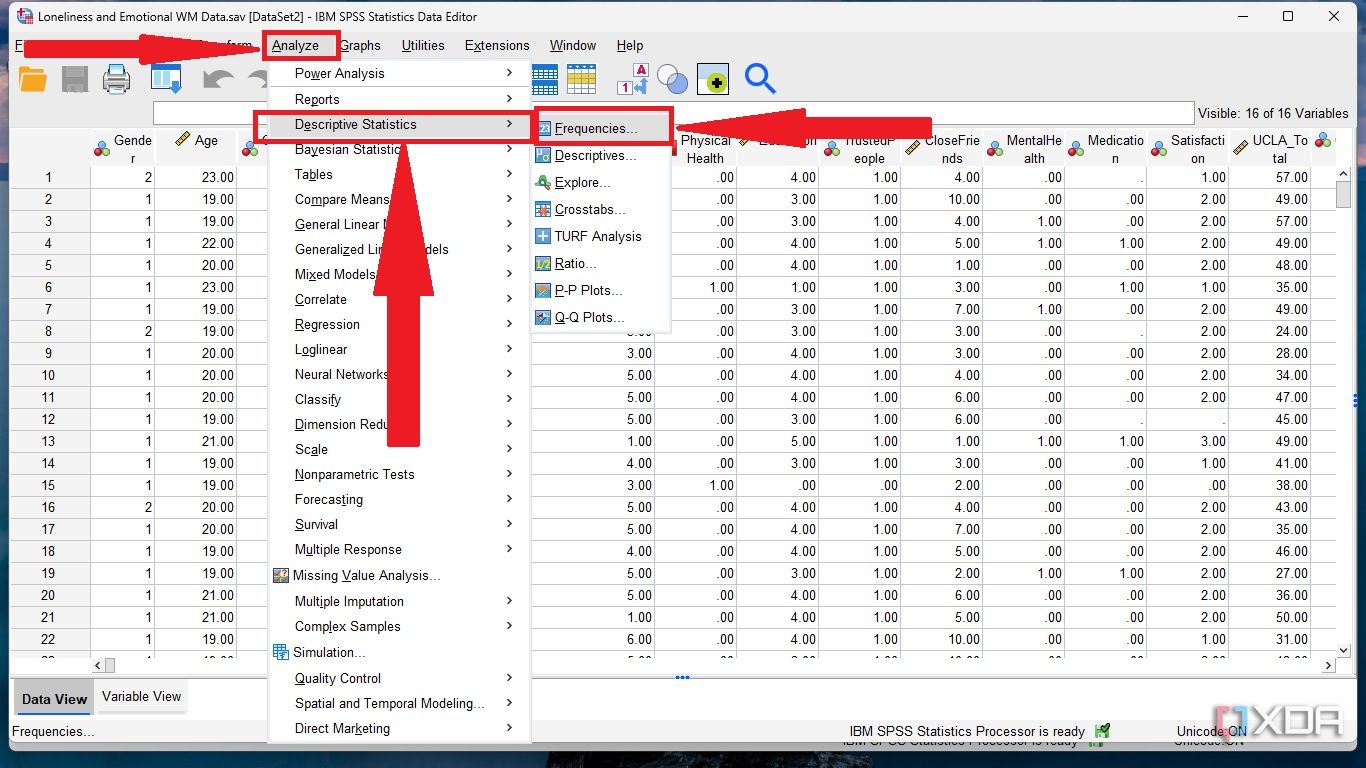
By conducting descriptive analysis on the dataset, you can fully simplify respondents' responses and make them easy to understand. You may start with a frequency table summarizing how respondents answer your question. You can access the analysis option from the top bar in either the variable view or the data view tab. To generate a Frequency Table:
-
Start by clicking Analyze -> Descriptive Statistics -> Frequency.
-
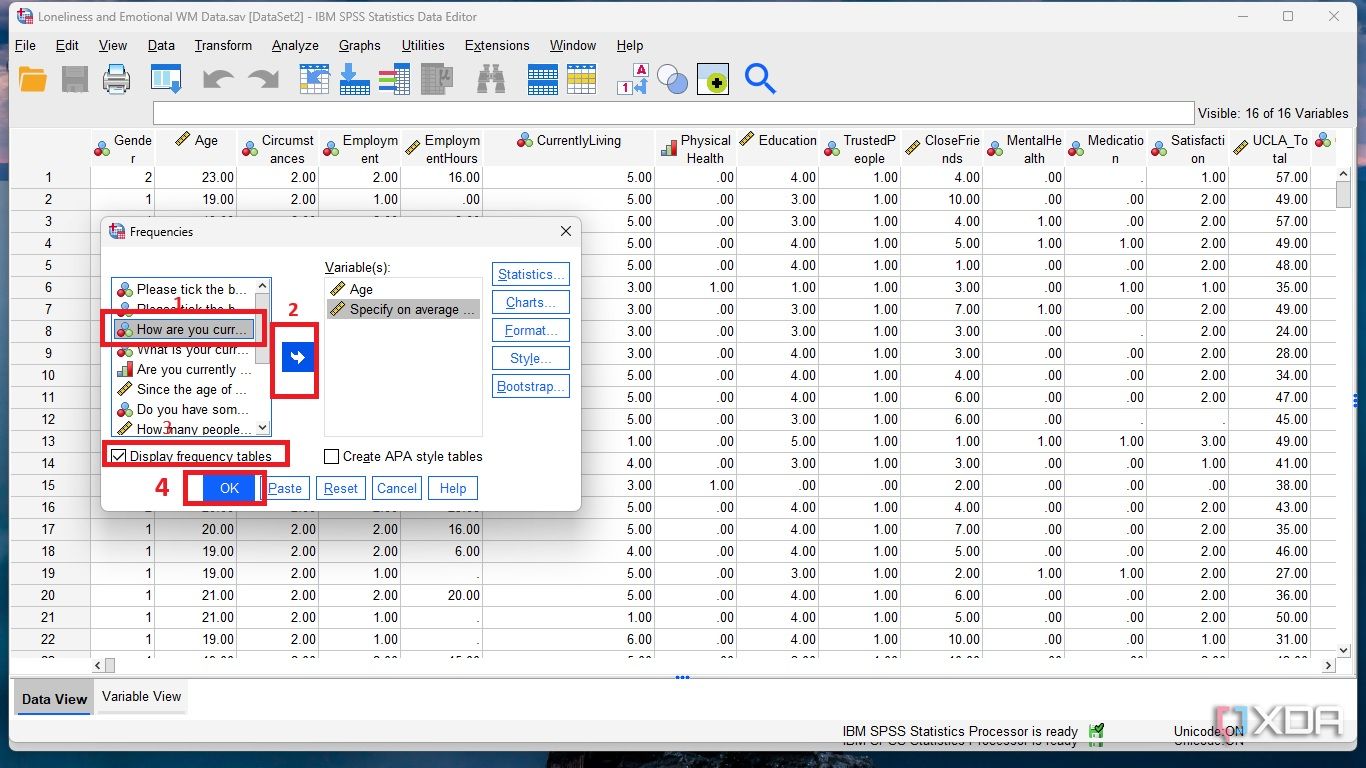
Select a variable, click the arrow next to it, click okay, and wait until the output is generated.
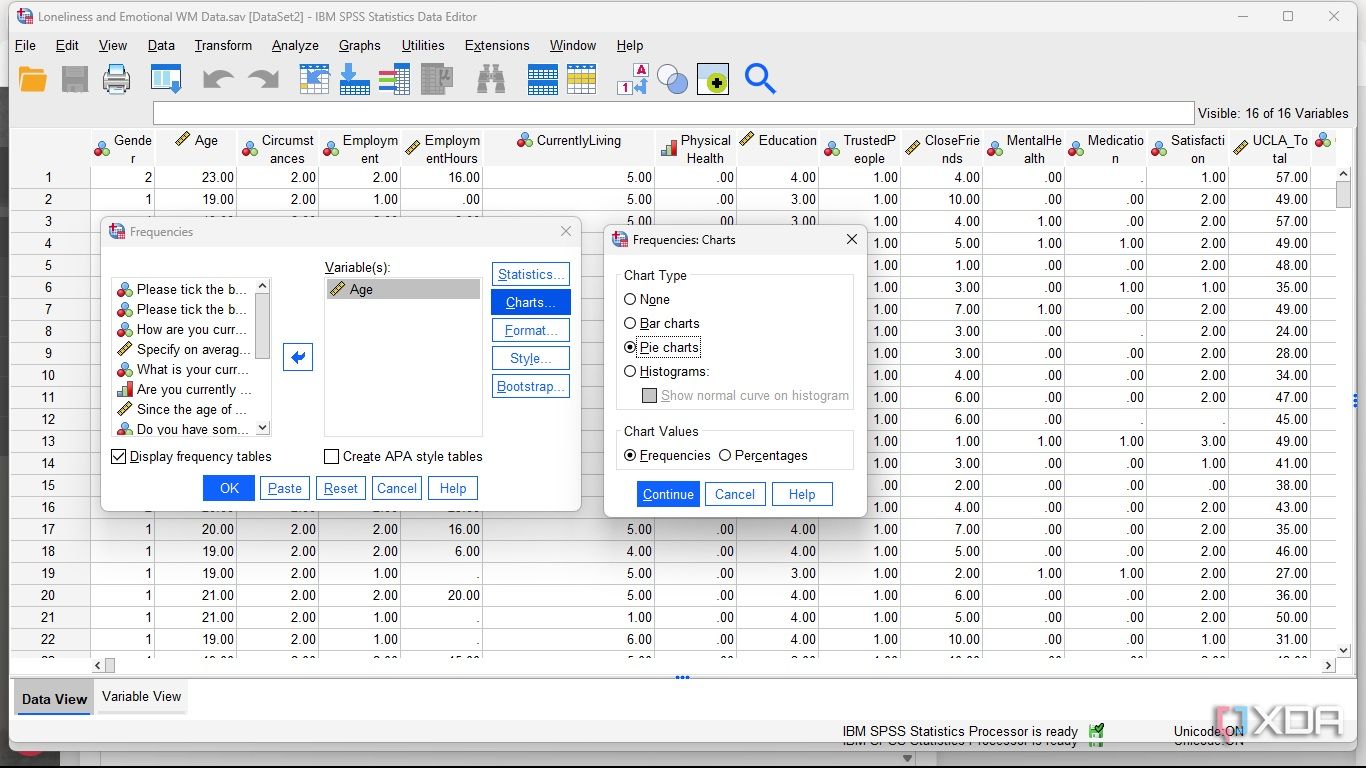
Aside from creating tables, you can visually represent respondents' answers with a pie chart and histogram. To generate a pie chart:
-
Click Analyze -> Descriptive Statistics -> Frequency
-
Choose Charts -> Pie chart or a histogram, pick your preferred chart values (frequencies or percentages), and click Continue.
Chi-Square Test
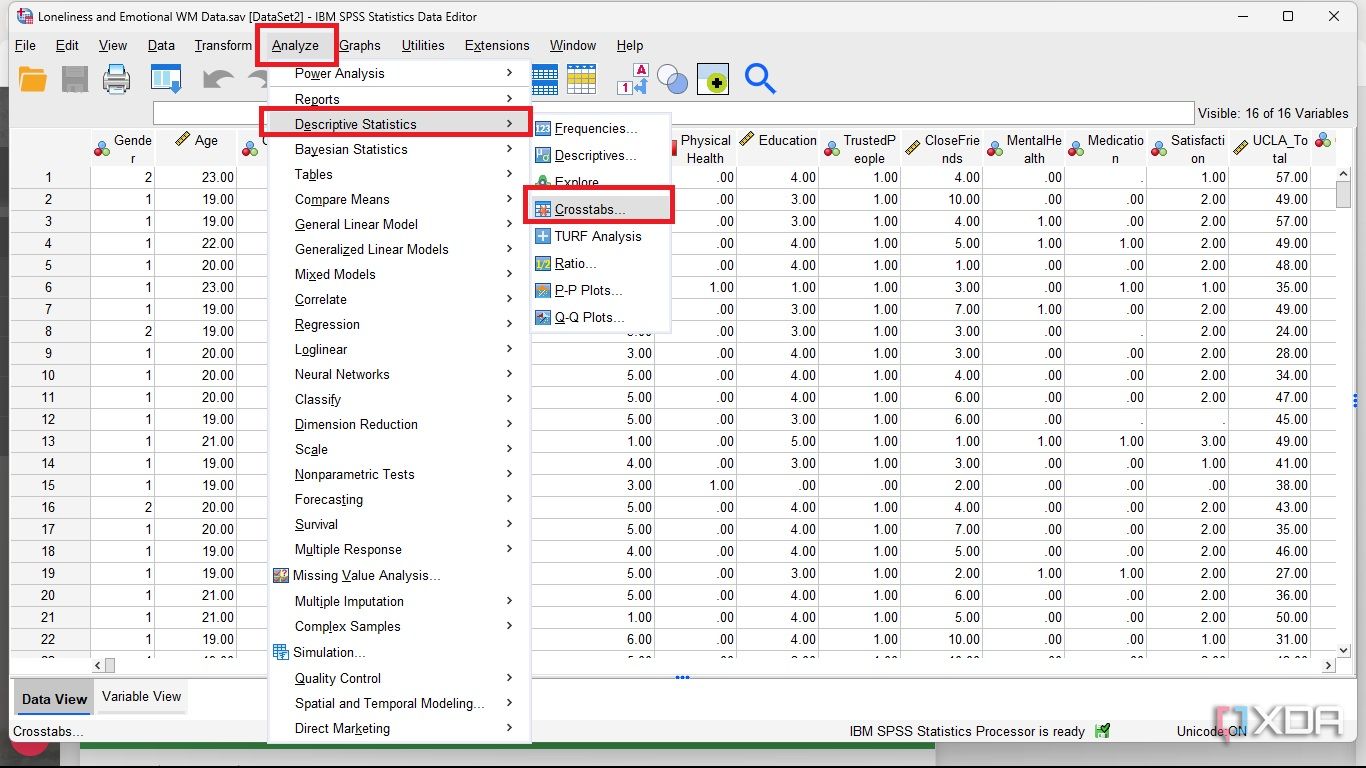
You may also examine the relationship between variables to gain a deeper insight into how each variable relates to others. The chi-squared test of independence could be carried out between variables you suspect might be associated with each other. Let's say you want to examine if there is a relationship between respondents' education and employment status. A chi-square test may be carried out. To do this
-
Click Analyze in the toolbar. Select Descriptive Statistics -> Crosstabs.
- Select a variable and send it to the row.
-
Select the second variable and send it to the column by clicking the arrow. (You may also use drag and drop.)
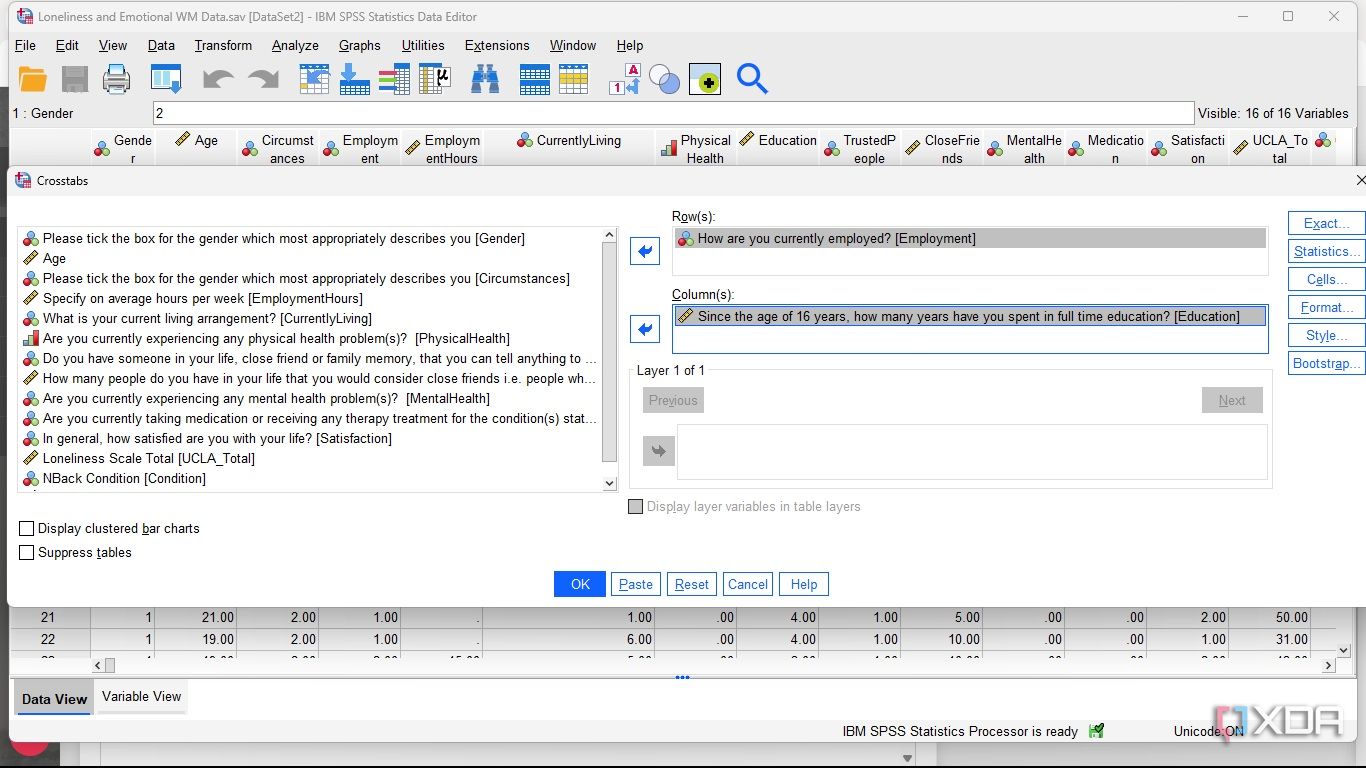
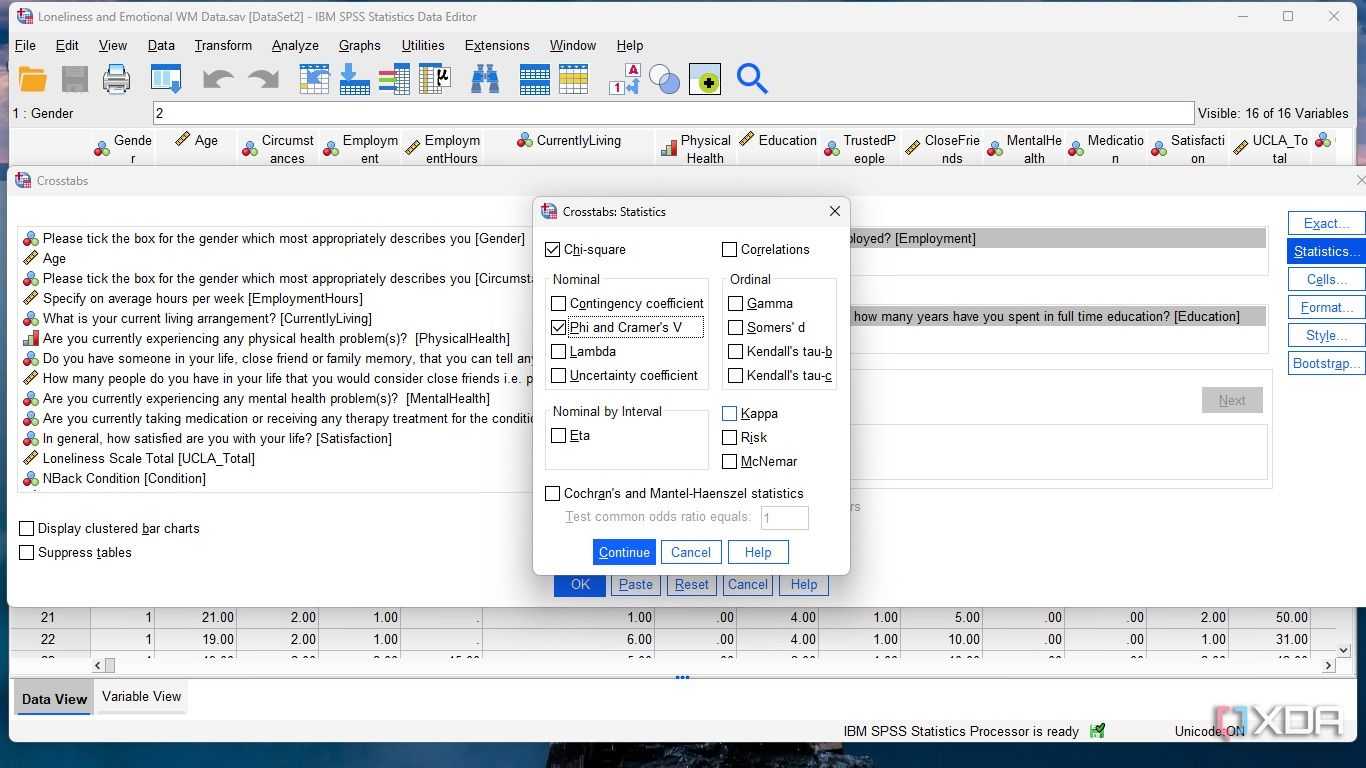
- Click Statistics on the right-hand side.
-
Tick boxes for Chi square and Cramér's V. Click Continue and OK. Your chi-square result will be displayed as output.

Related
Utilize the tools in the SPSS toolbar
This guide can be useful in handling descriptive statistics and testing the relationship between variables using SPSS. That said, the focus of your study may differ from the above. Hence, you may need to go beyond the examples in this guide, carry out more tests, and generate more charts. The bottom line is that once you create your variables and input respondents' data, you can use the analytical tools in the toolbar to conduct your analysis.


 English (US) ·