.png)
I've never been much of an athlete, but lately, I've been trying to work on my fitness. As a self-professed data nerd, quantifying data and my activity patterns is essential. So, I turned to the de facto choice — Strava. But, if you’re someone who tracks every ride, run, or hike on Strava, there’s a good chance you’ve stared at the activity feed of your fitness tracker and wished for just a bit more. More control, more context, more meaning. It's not that Strava doesn't offer all that. However, much of it is locked behind a paywall, and you can't really play with it beyond what Strava will let you.
That all changed when I discovered Statistics for Strava, a self-hosted tool that gives you full control over your fitness data. If you’ve ever wanted to dig deeper into your workouts, customize how your stats are displayed, or just keep things private and in your hands, this might be exactly what you’re looking for.
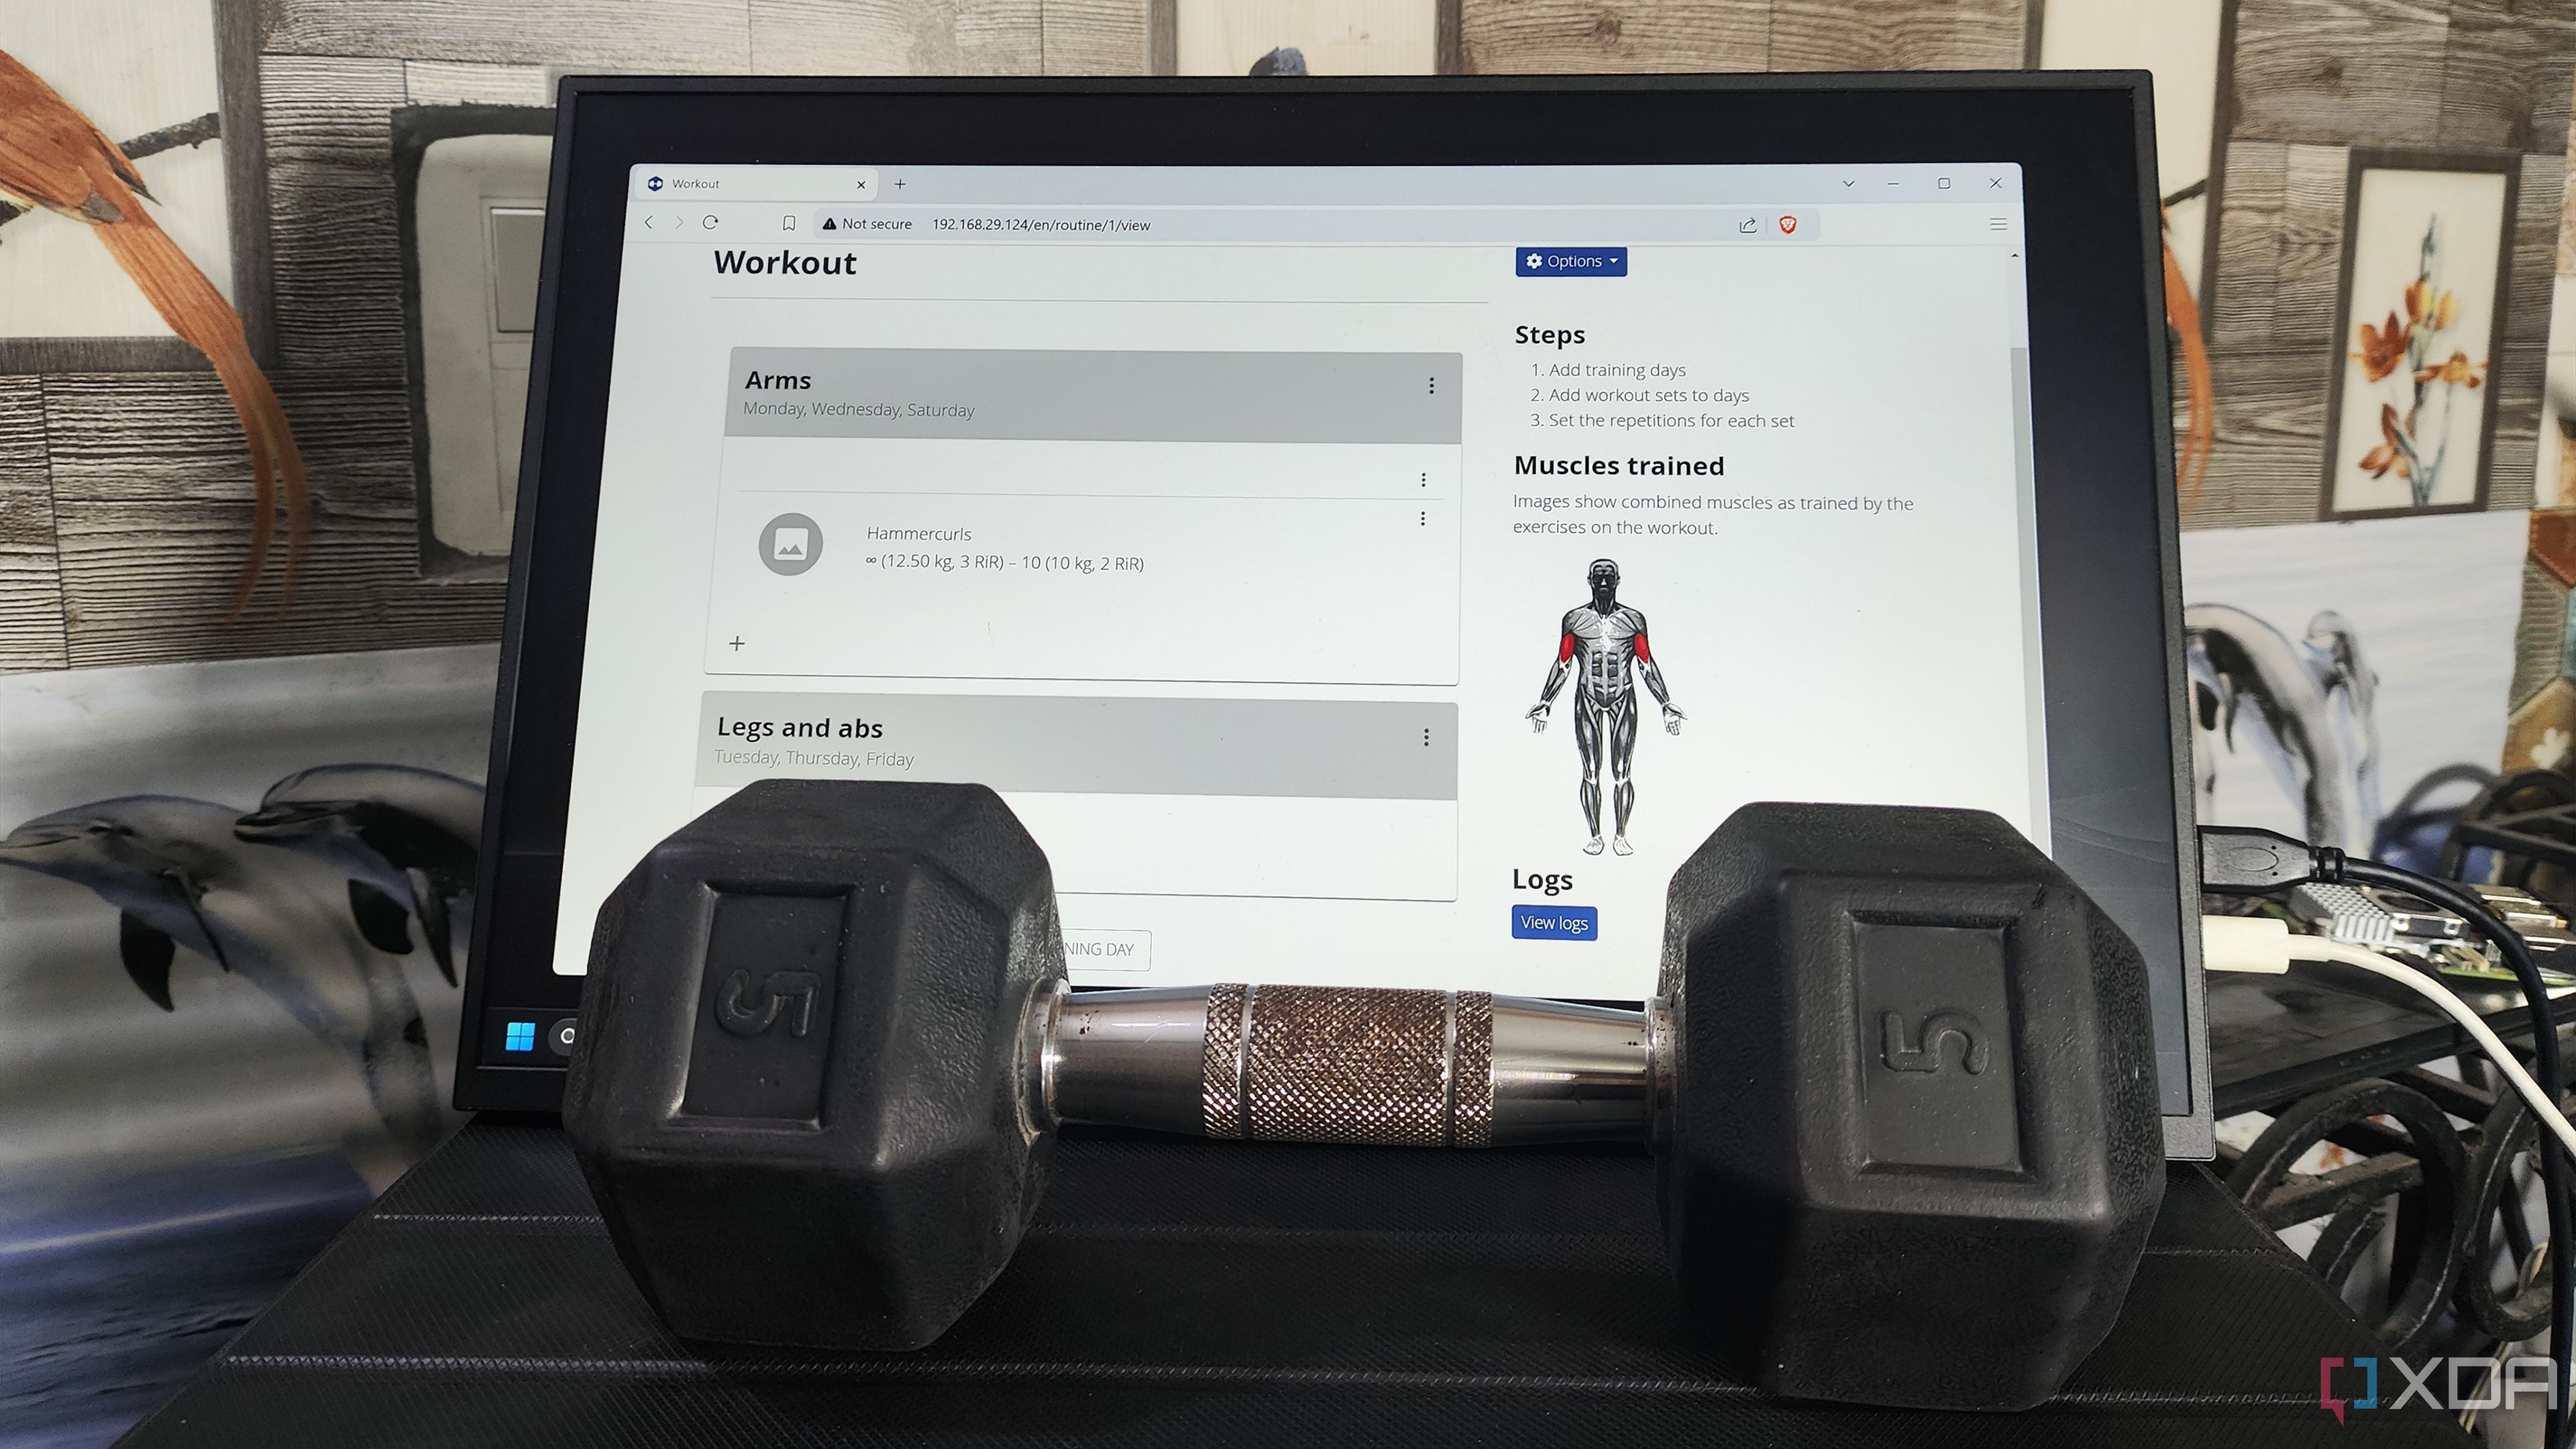
I self-host wger to track my fitness goals - here's how
At last, a self-hosted service that motivates me to touch grass and lift weights instead of feeding my obsession with tech
A fitness dashboard that’s yours
Hosting your own Strava companion
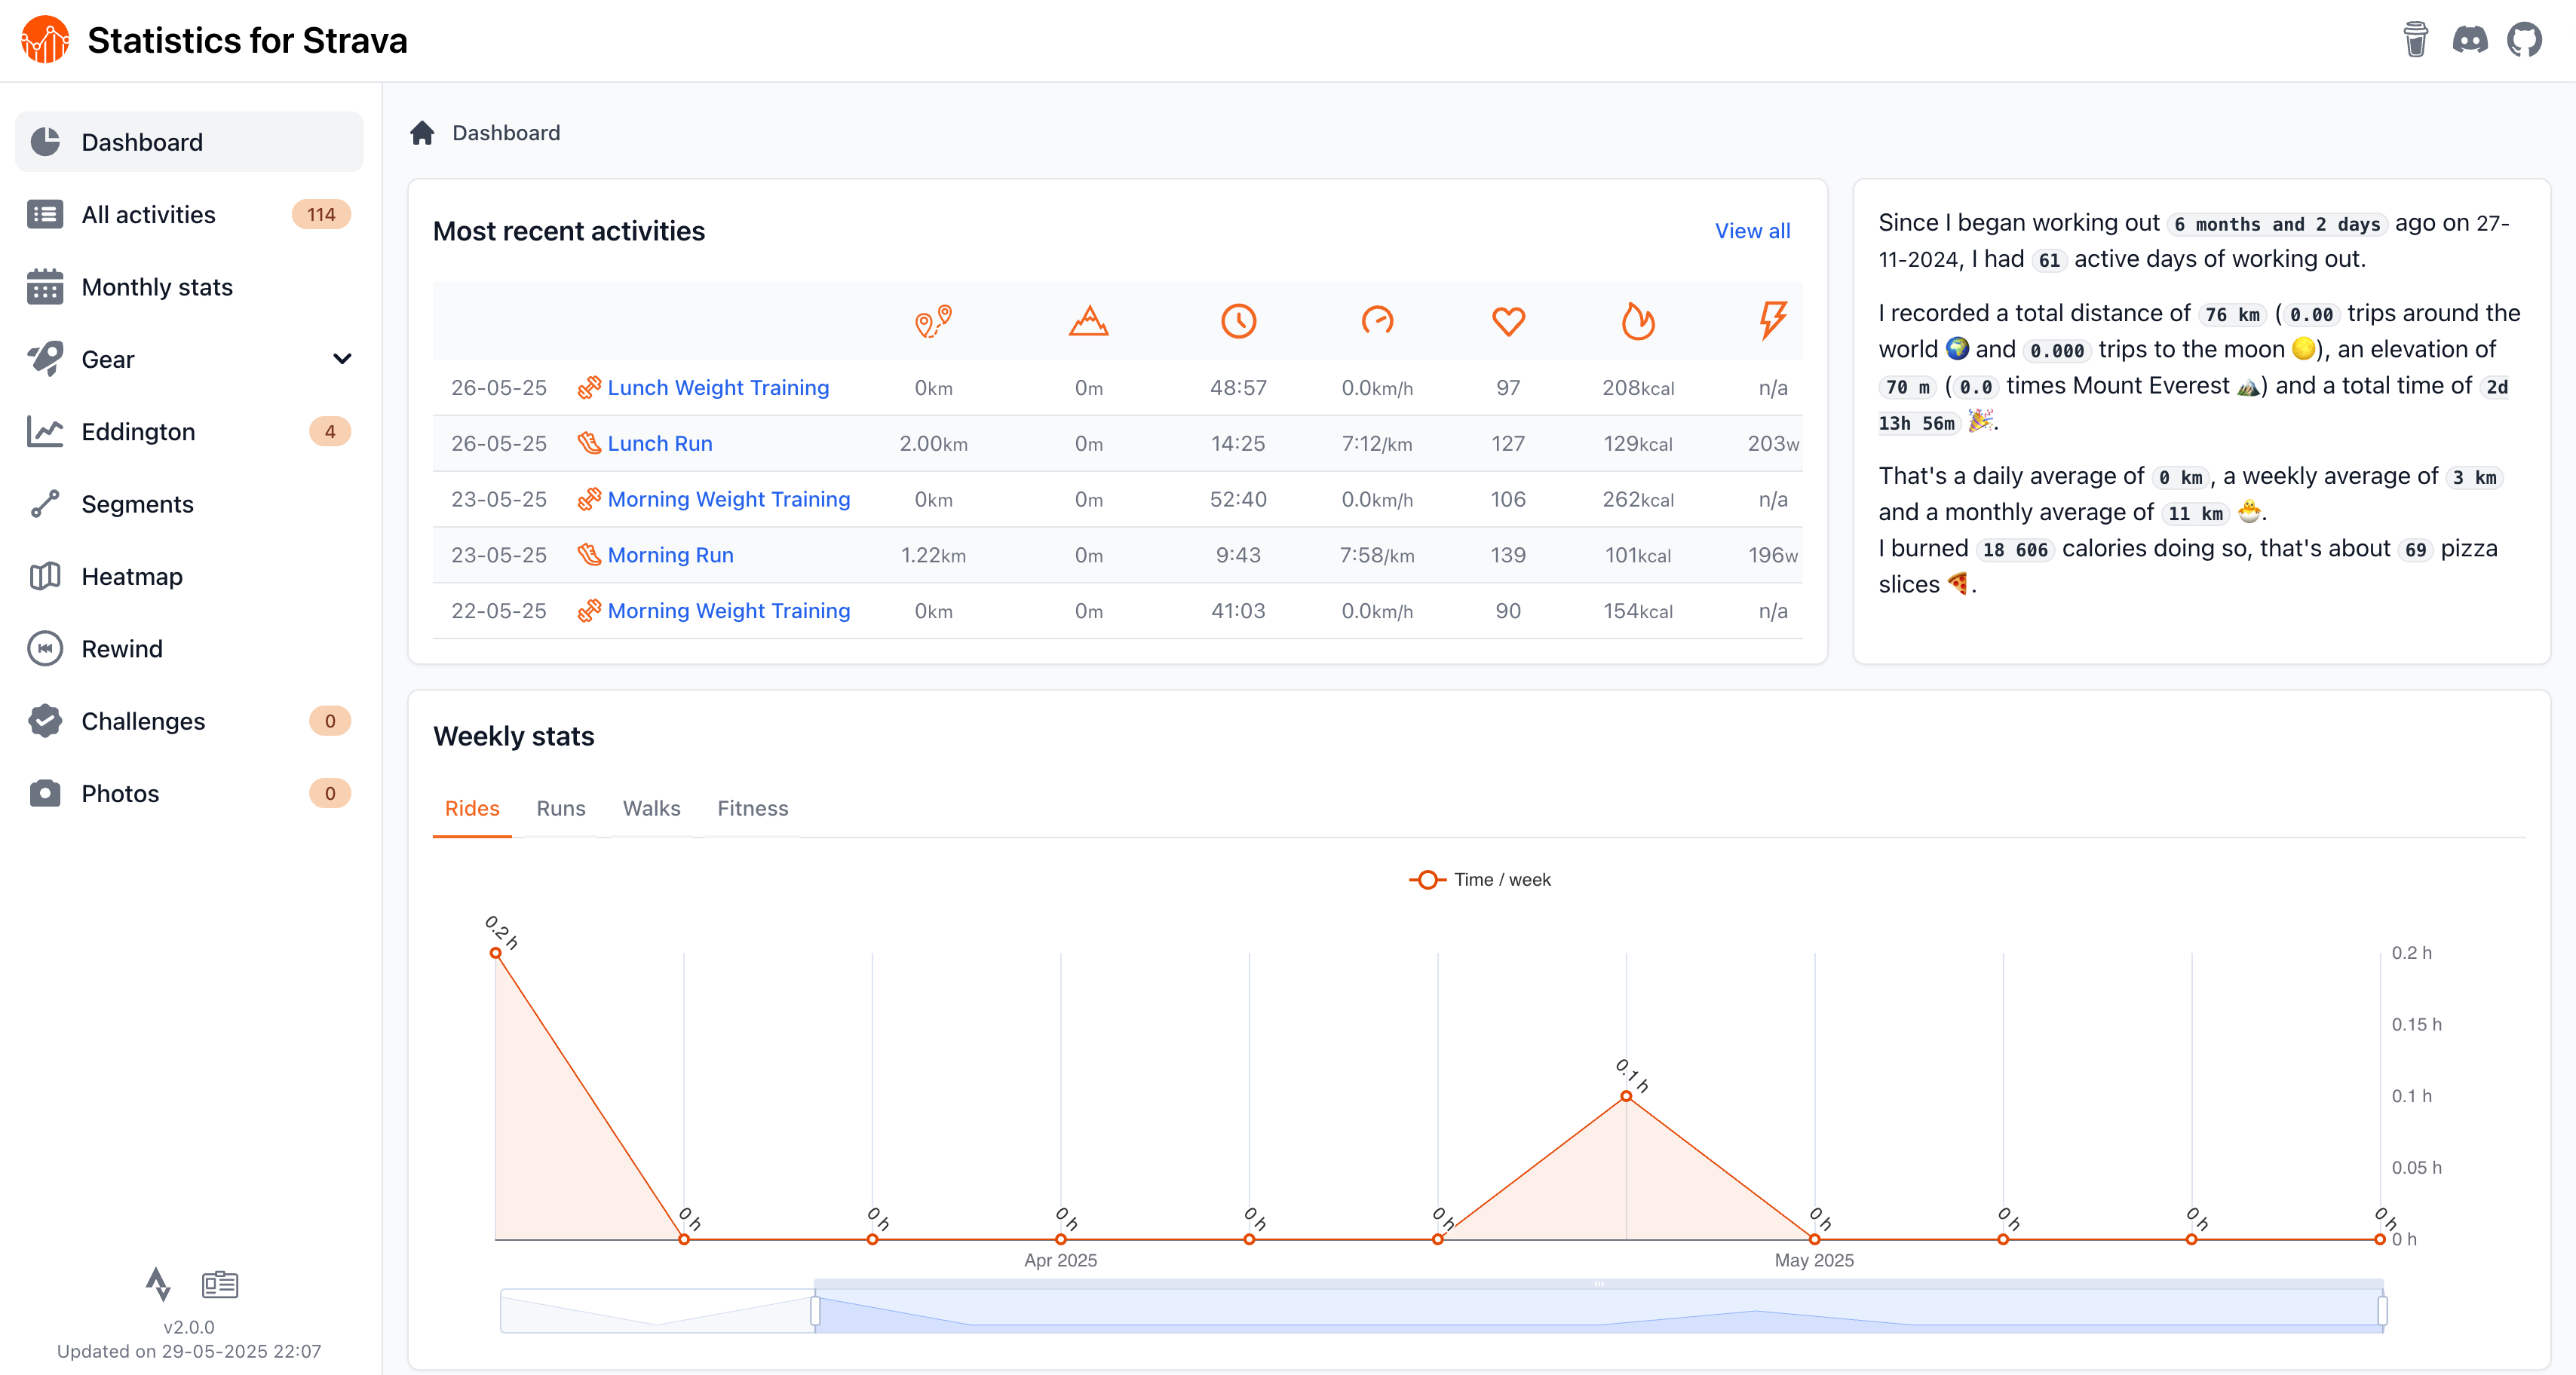
The appeal of Statistics for Strava is pretty simple — you own the experience. It’s not a third-party service that stores your information in someone else’s cloud. It’s a fully self-hosted dashboard that connects to your Strava account, pulls in your data, and presents it in a way that feels deeply personal. I set mine up on a local Docker container, and within a few minutes, I had a clean, sleek dashboard that showed every ride and run in a format I could control. Moreover, it pulls in all your Strava data, even if you've been tracking your workouts for years, allowing you to glean better historical insights.
For users who aren’t familiar with self-hosting or Docker, the setup might sound intimidating. But the official documentation walks you through the entire process step-by-step. Personally, I found the learning curve to be surprisingly manageable, and the developer is extremely active on GitHub to help you resolve any installation-related issues.
The app gives you a monthly calendar that highlights your training load at a glance, as well as a feed of your latest activities. There are ample filtering options here, giving you the opportunity to view sport-specific improvements. You'll also find a map view that shows all your GPS traces stacked together so you can see which routes you frequent most. For anyone who’s motivated by progress and patterns, this is pure gold.
Since it connects via the API, almost every metric tracked by Strava is available to you. If you so choose, you can further enhance the dashboard to meet your own requirements, which is just not possible within Strava's interface.
Richer insights and smarter metrics
Dig into the details that matter to you
One of the reasons I started looking beyond Strava was that I wanted to track more than just pace and distance. I wanted to understand how my heart rate zones evolved over time, how consistent I’d been with my cardio and strength training, and whether my functional threshold power was holding steady. Statistics for Strava handles all of that with grace.
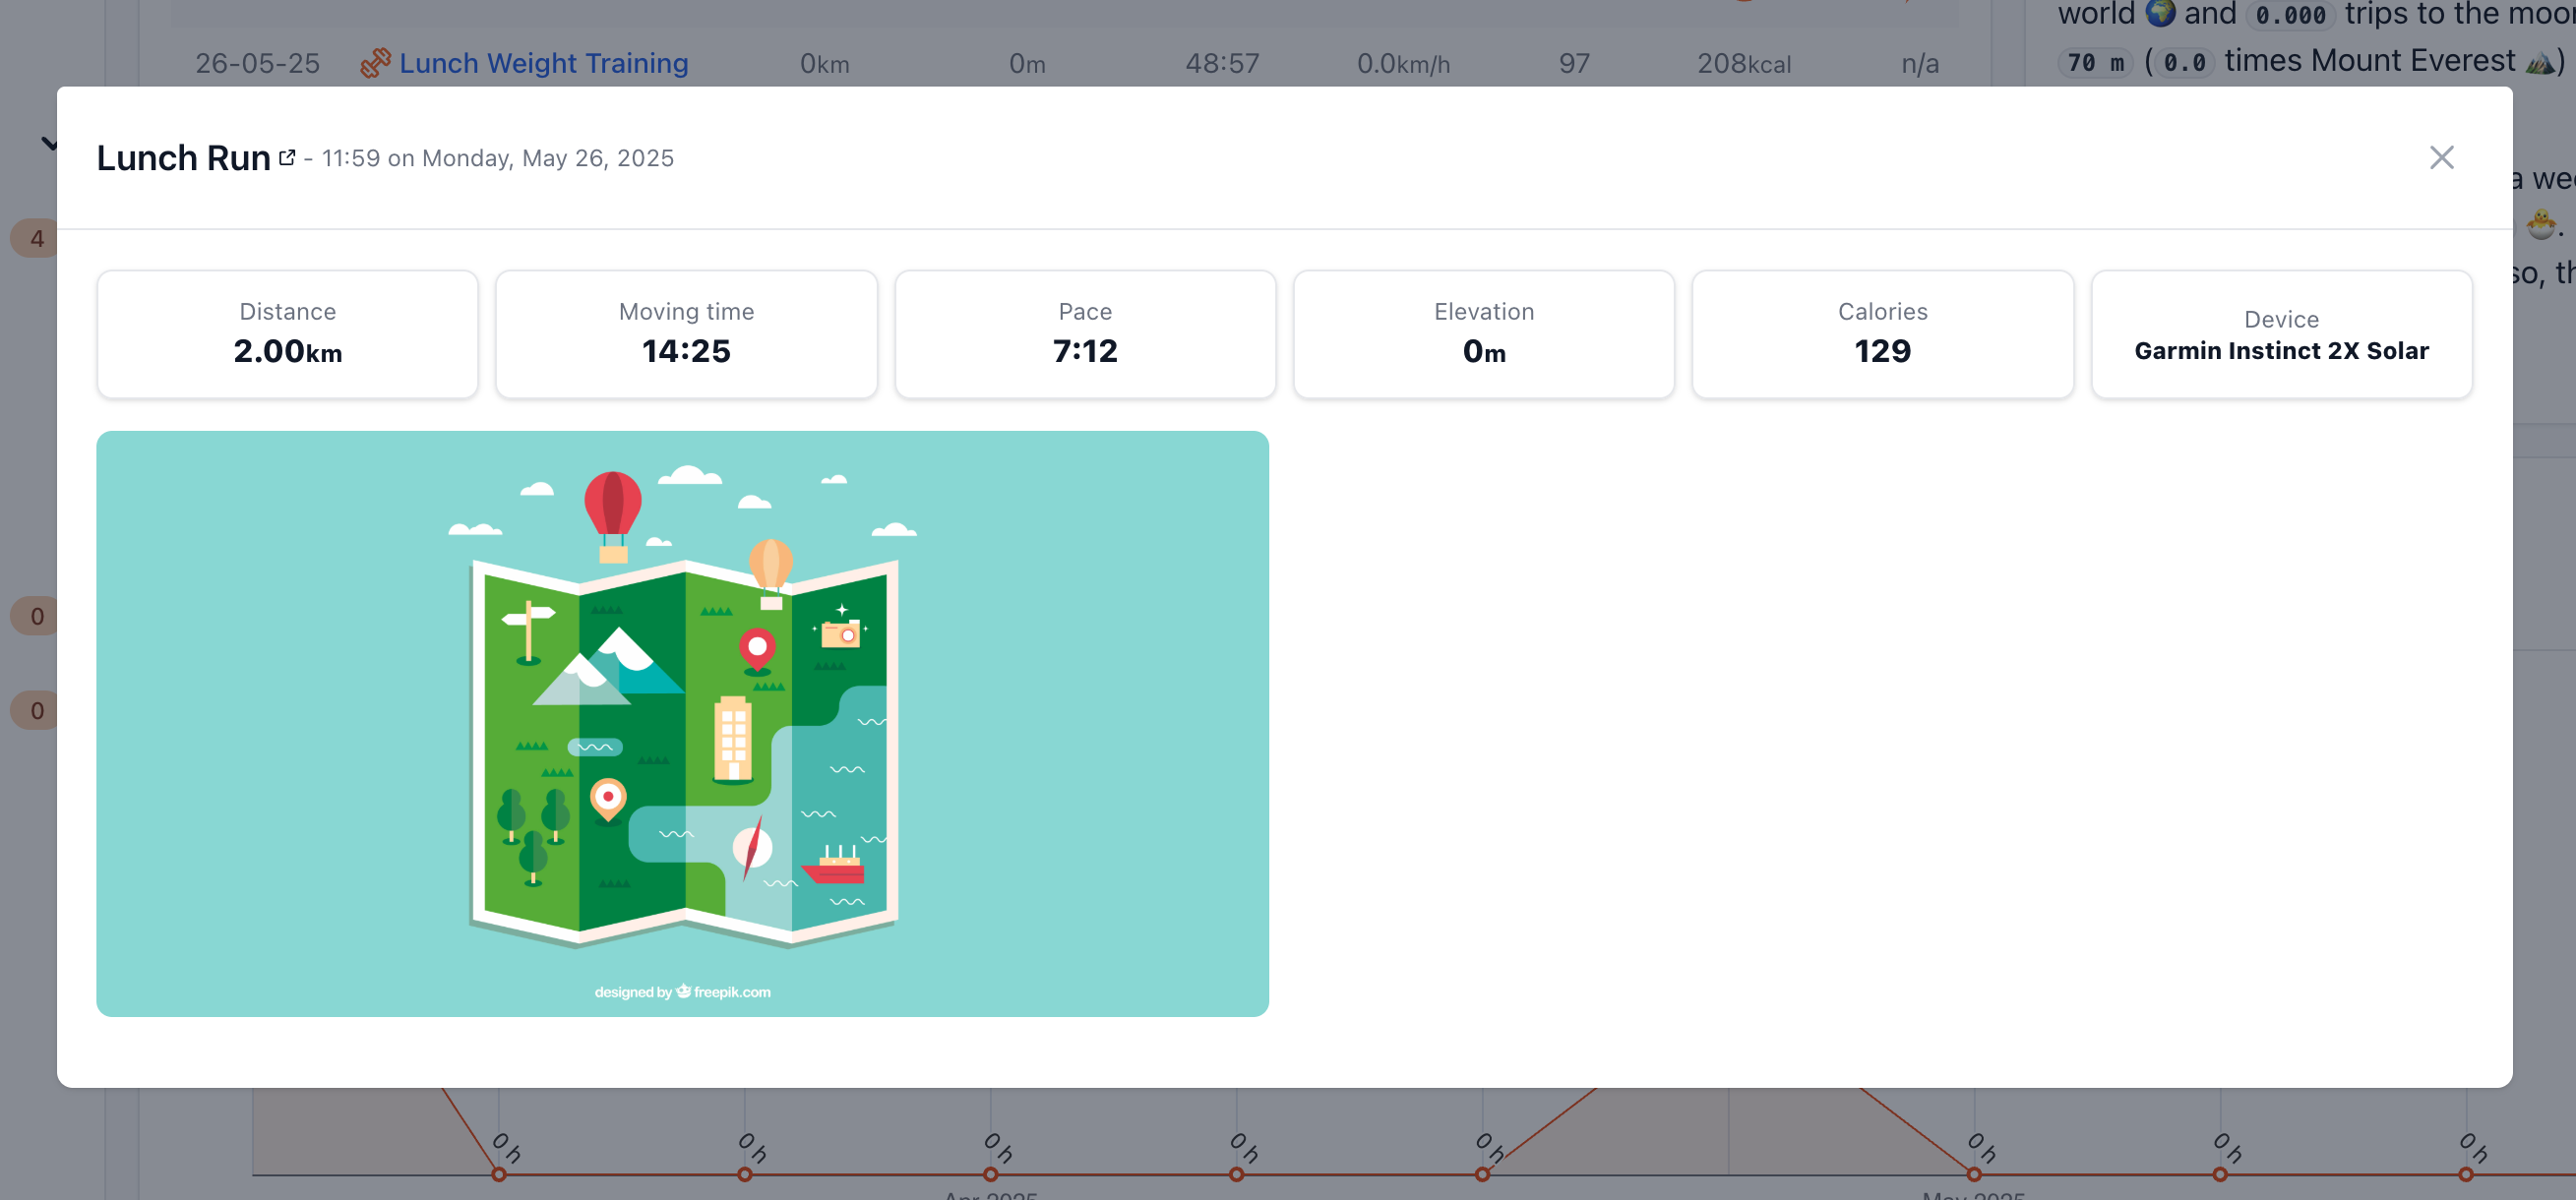
One of the standout features of Statistics for Strava is its ability to provide detailed metrics and visualizations. The dashboard allows you to explore various stats and charts, view a detailed list of all your activities, and analyze monthly stats with a calendar view. What’s especially valuable here is how the tool encourages you to engage with your own performance trends in a more analytical way. For instance, you can track your average heart rate by sport, break down your speed over time, and compare similar workouts to see how you’re progressing. This kind of granularity can really help if you’re training for a specific event or just trying to prevent plateaus.
It also gives you your Eddington number, which I didn’t even know I wanted to track until I saw it on the dashboard. And if you ride or run often enough, you’ll love the gear tracker, which lets you keep tabs on how many kilometers you’ve logged on your shoes or bike. It's an excellent tool for getting a heads-up on when your running shoes might be due for an upgrade.
Additionally, you can generate heatmaps to visualize your activity patterns and enjoy features like Strava Rewind, which offers a retrospective look at your year in motion. I haven't worked out enough yet to get access to that, but it's available for you if you need it. And none of this is behind a paywall. There’s no upsell and no prompt to upgrade to unlock basic features. If you’ve ever paid for Strava Premium and felt that the training dashboard was too limited or too static, this tool feels like a refreshing alternative.
Full control and true privacy
A data-first experience without compromise
One of the biggest reasons I made the switch was privacy. I’ve always been a bit uneasy about how much of my fitness life lives in the cloud. While Strava is generally good about settings and permissions, you still don’t fully own your data. Statistics for Strava changes that.
Because it’s self-hosted, you can keep everything on your local machine or server. Now, given the nature of the service, this doesn't mean that your data isn't residing on Strata's servers. However, you retain a copy of your own fitness data. As we recently found out with Pocket, popular services go down all the time, and so does the data with it. Maintaining control over your data means that you can continue to build on it even if a service goes down. You decide what’s tracked, how it’s displayed, and when it gets updated. And for me, that kind of ownership made training feel more intentional.
Why this self-hosted dashboard is the perfect accompaniment to Strava
It’s worth saying that this isn’t about replacing Strava. I still use Strava every day, especially for its social features like kudos, comments, and segment leaderboards. What Statistics for Strava does is complement it. It fills in the gaps, gives me more control, and makes the data I generate feel more useful.
Strava Premium offers some great tools, such as training plans, matched runs, and live segments. But if you want to go further, see how your performance trends over time, or understand your load in a way that’s tailored to your physiology, this self-hosted dashboard gives you the freedom to explore those questions in your own way.
There’s something satisfying about self-hosting your own data and building a tool that reflects how you train and what you value. Statistics for Strava isn’t just for coders or tinkerers. It’s for athletes who care about progress and who want their data to tell a clearer story. Whether you’re training for your first 10K, eyeing a cross-country ride, or just trying to build a healthier routine, it gives you the tools to measure, reflect, and improve on your own terms. If you’re already logging every workout, it’s worth investing in a setup that makes that effort count for more. This is what that looks like.


 English (US) ·