.png)
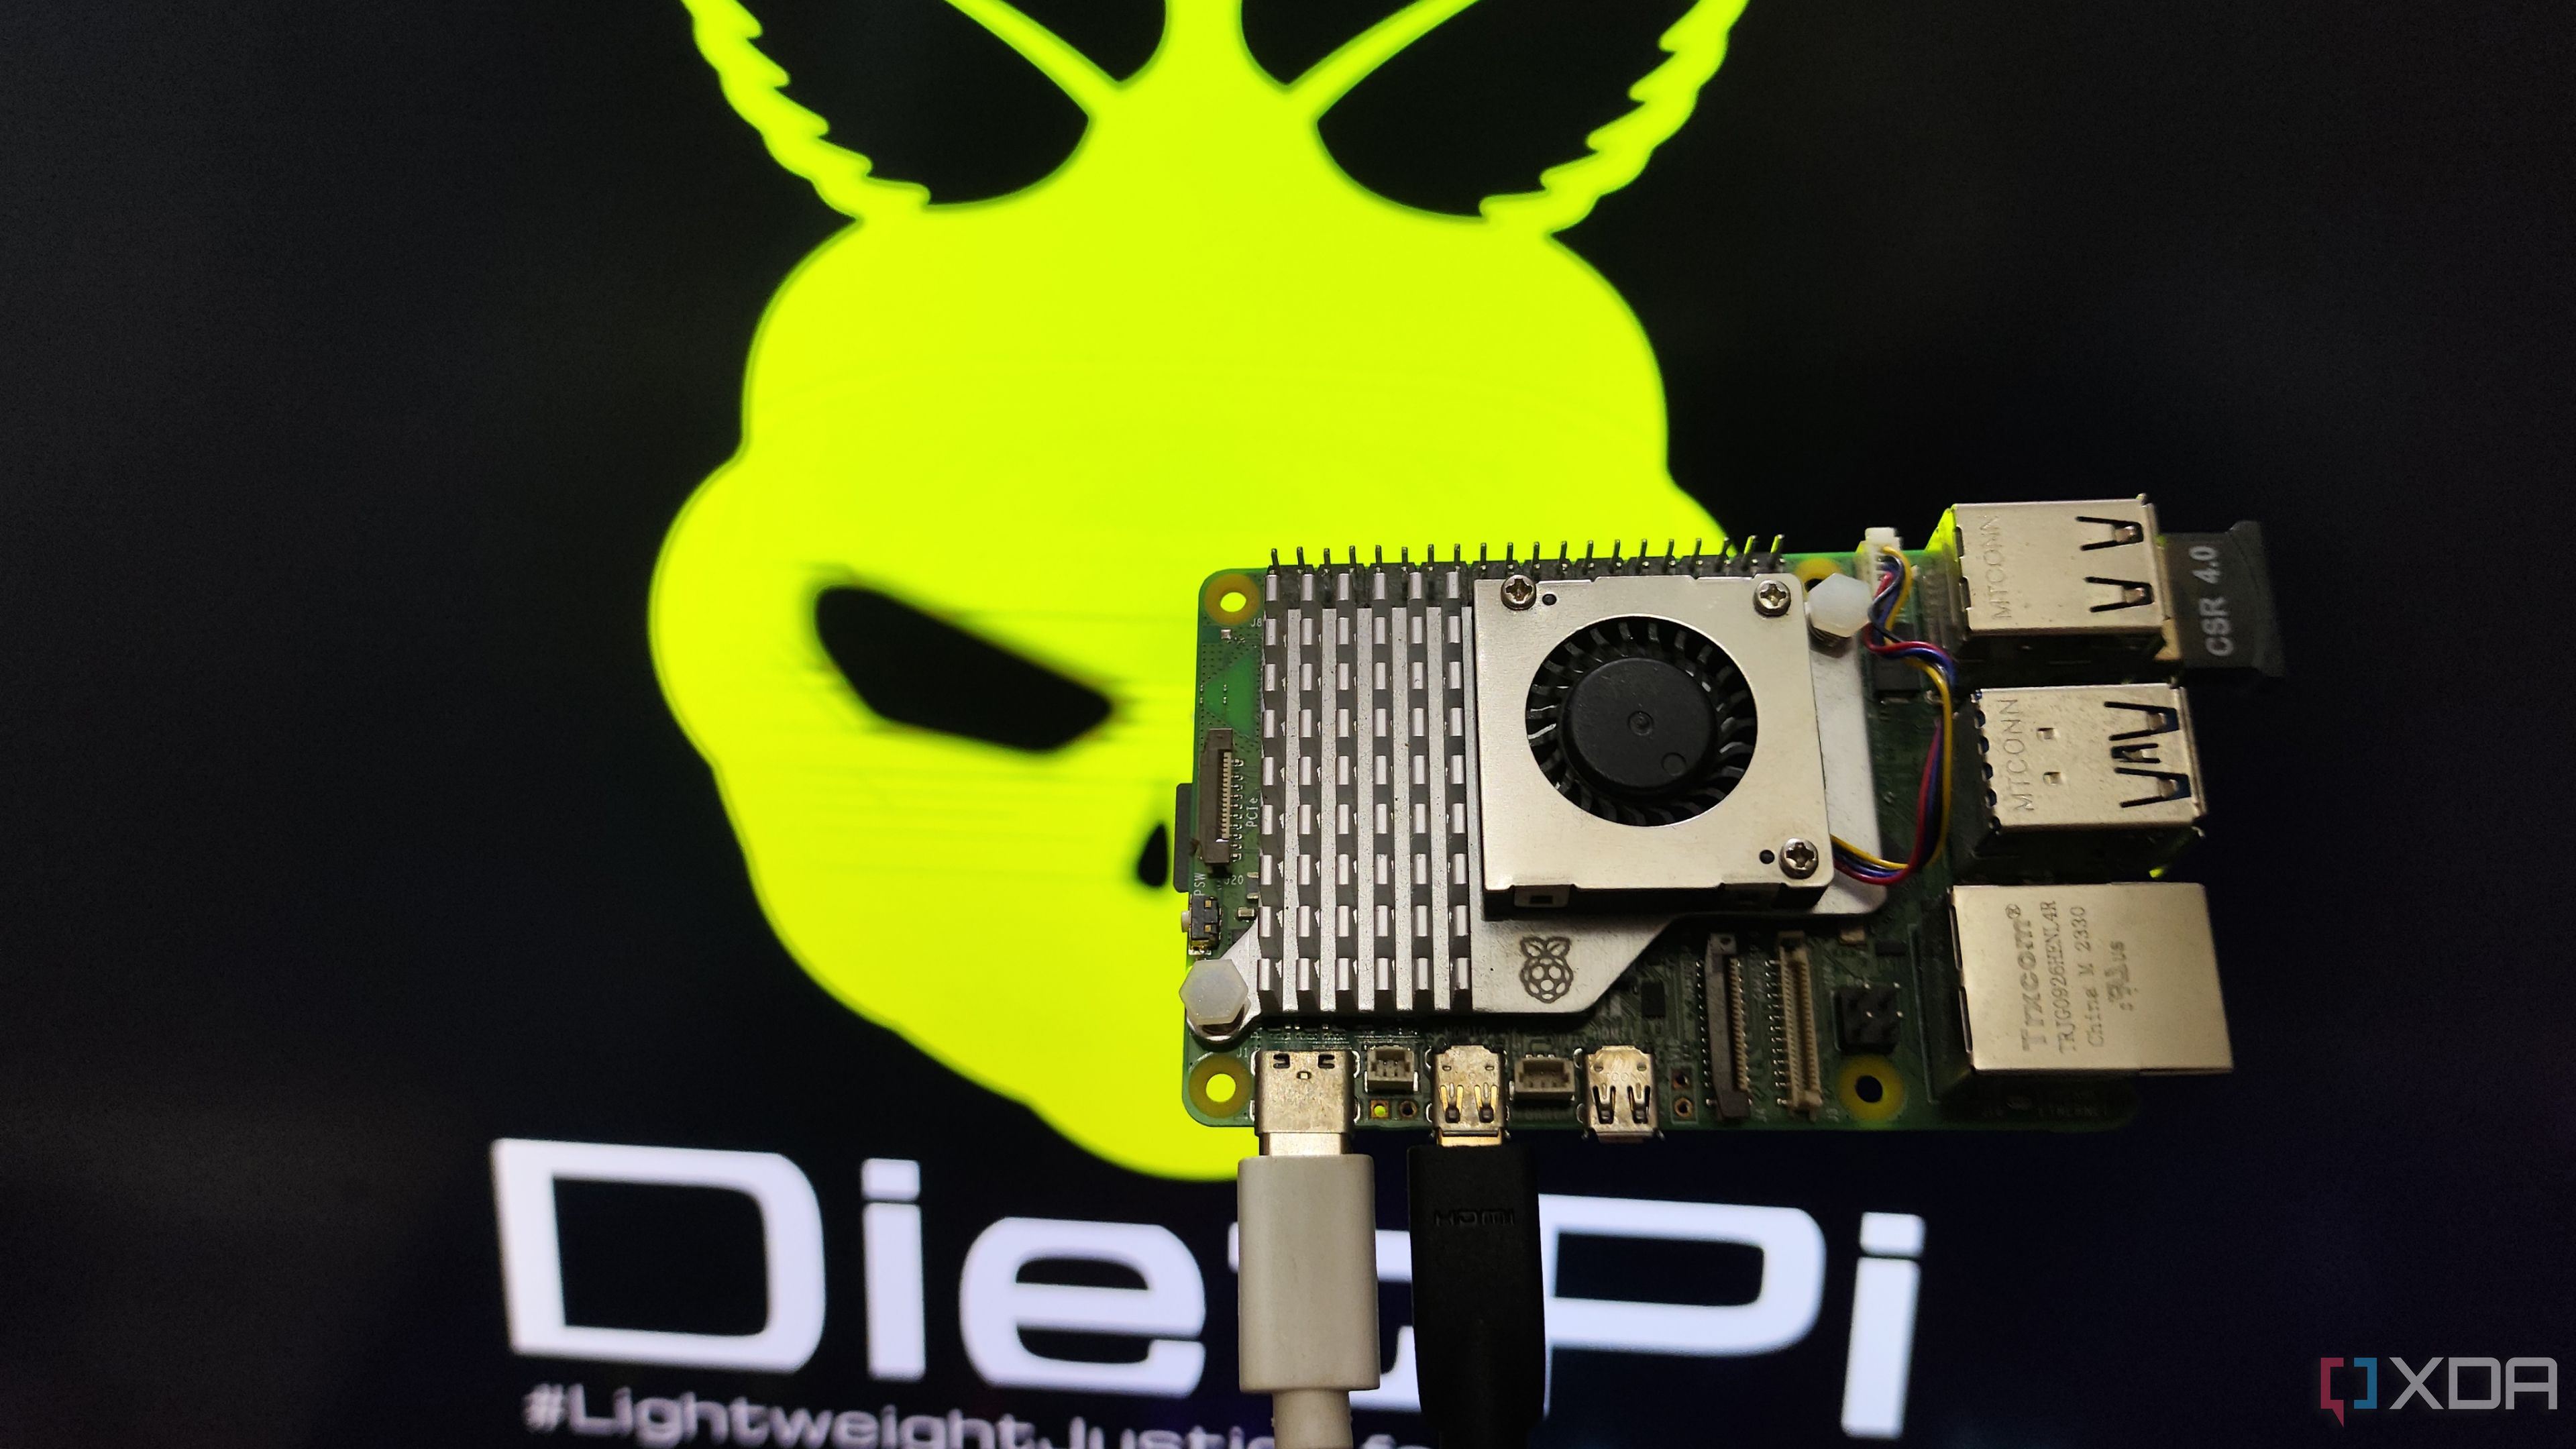
I prefer non-graphical Raspberry Pi operating systems over the GUI versions because of the strain they put on my Raspberry Pi Zero 2W. Running a GUI OS like Raspberry Pi 64-bit is difficult without a fair share of stutters, so I've shifted to DietPi. It's lighter and faster and doesn't make my Pi Zero 2W feel like a slowpoke while running services like Jellyfin, File Browser, and many more. However, I miss the comfort of a GUI like Windows or Ubuntu on the Pi. DietPi has a solution with a custom dashboard I was unaware of.
DietPi Dashboard is a web-based service that gives a much-needed GUI revamp to the OS. It includes all the essential OS management programs, a neat interface, and supports shell integration. All of this works inside a browser on your local network, but there are more possibilities too. Let's explore how to use DietPi Dashboard to your advantage, so you don't have to bother with SSH until necessary.
Related
5 SSH features you might not know about
If you've ever used SSH, these are some features you might not know about that you can make use of.
Setting up DietPi Dashboard
Installation needs attention!
DietPi Dashboard is available inside the operating system's software installation suite. You only need to launch the DietPi-Software utility from the terminal and then browse or search for the Dashboard. Then, install it via the terminal and ensure you pick the stable release. Go for the Nightly release only if the stable throws an error. Also, don't ignore the warning about front-end installation. Select no and proceed.
Then force restart your DietPi once the installation completes. It'll create a new dashboard service on your system that automatically runs at startup. You can also install it from the developer’s official GitHub page.
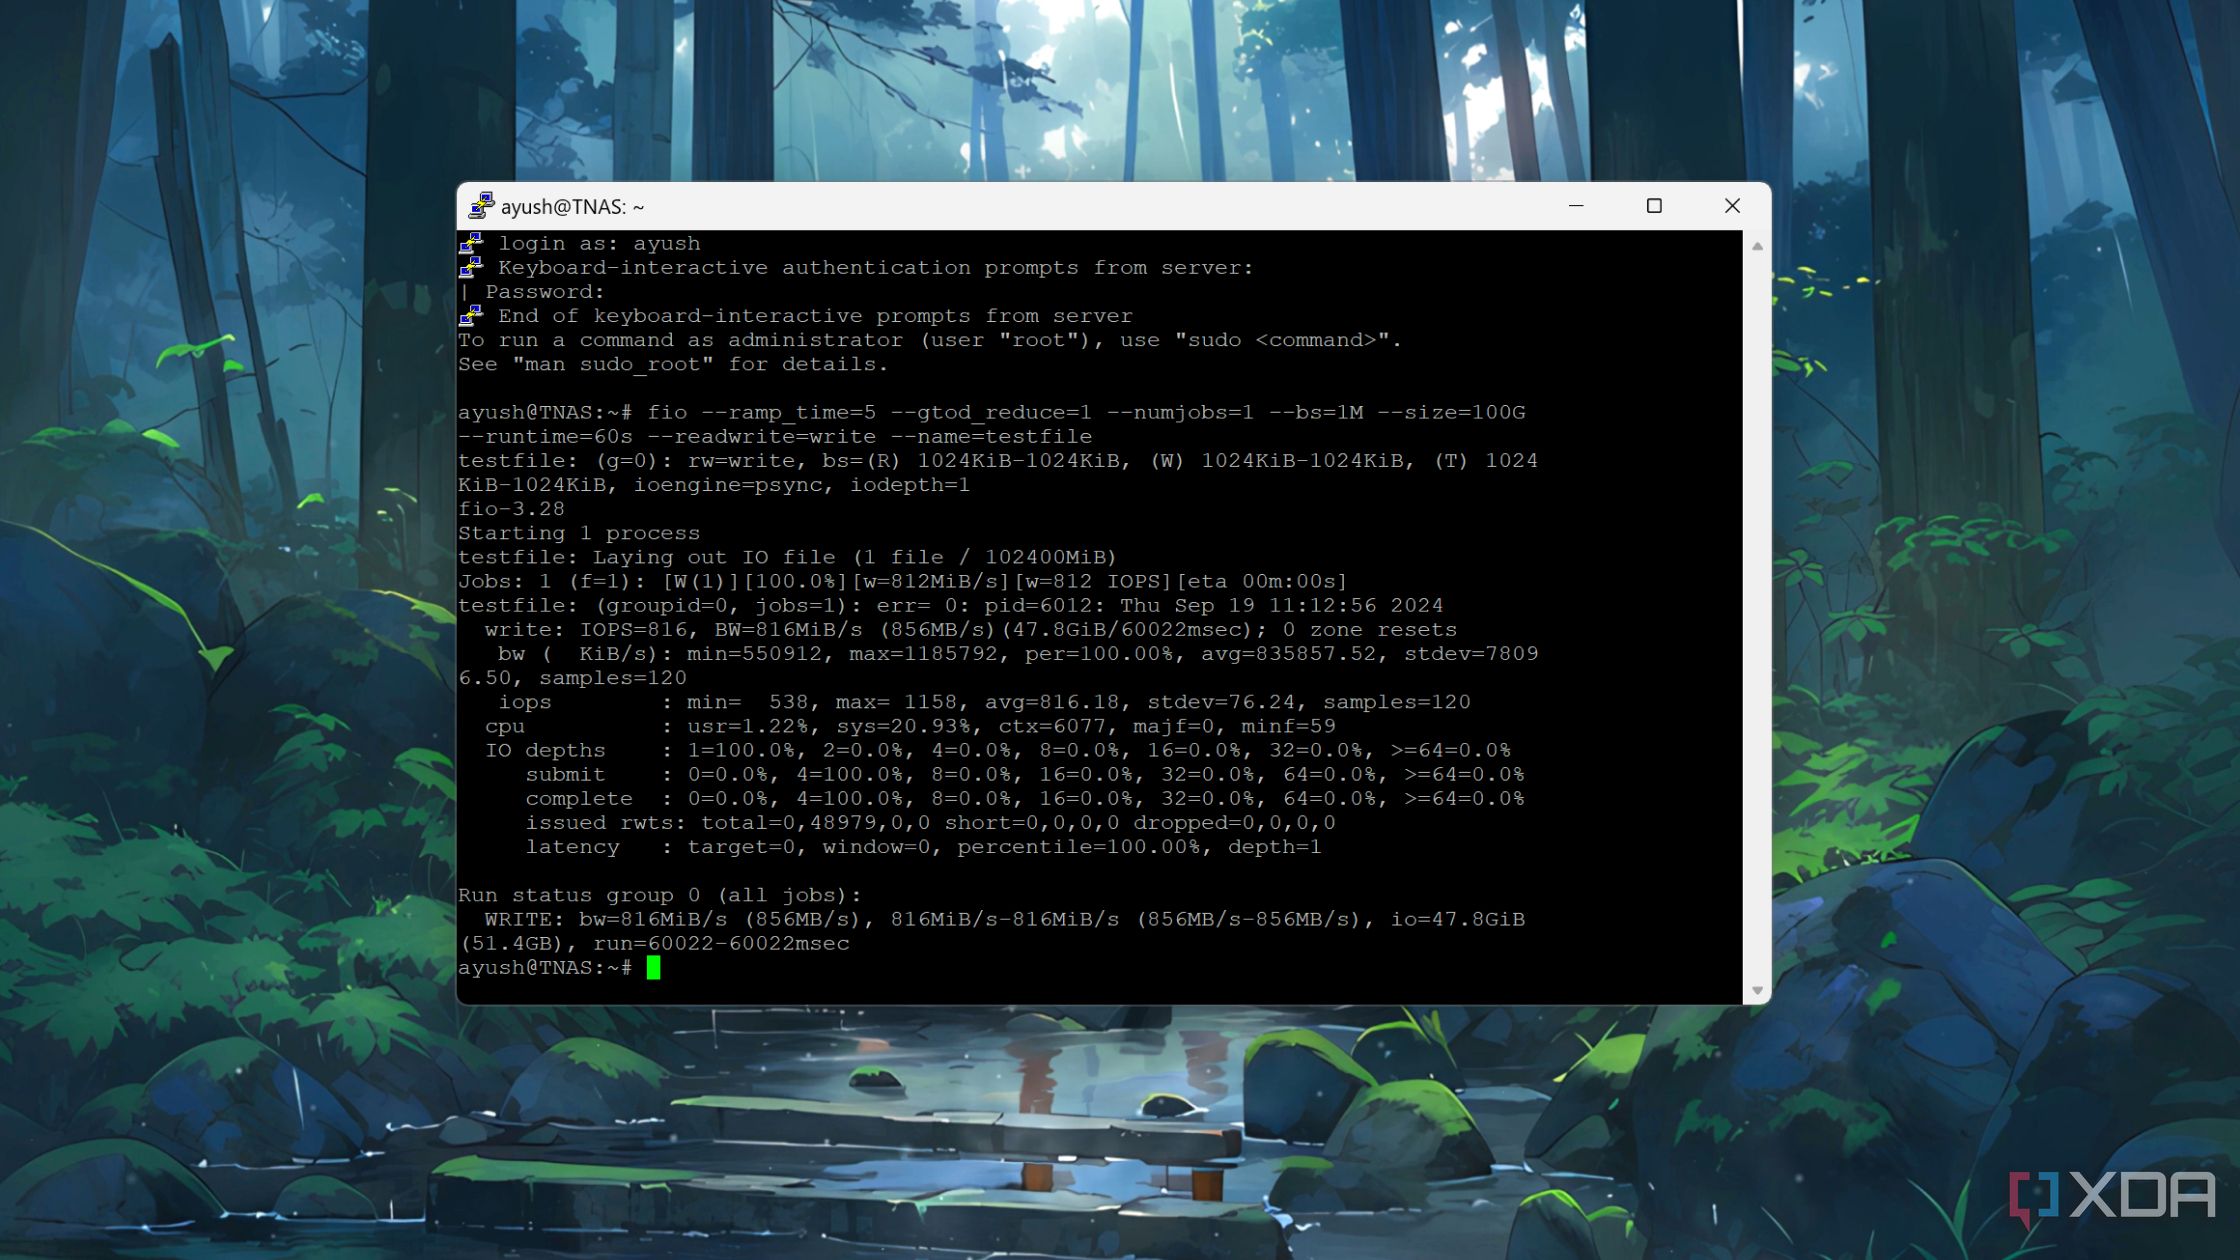
After that, you must find the port assigned to the Dashboard service. It's 5252 by default, but I've had problems locating and accessing the dashboard. So, check the assigned port number using the terminal with the ss -tulpn command and note it. Open any web browser and type dietPiipaddress:dashboardport to access the web UI.
In my case, it's 192.168.x.x:5252. However, the UI failed to load and threw a "Method not allowed" error.
Related
Troubleshooting the Pi
What went wrong?
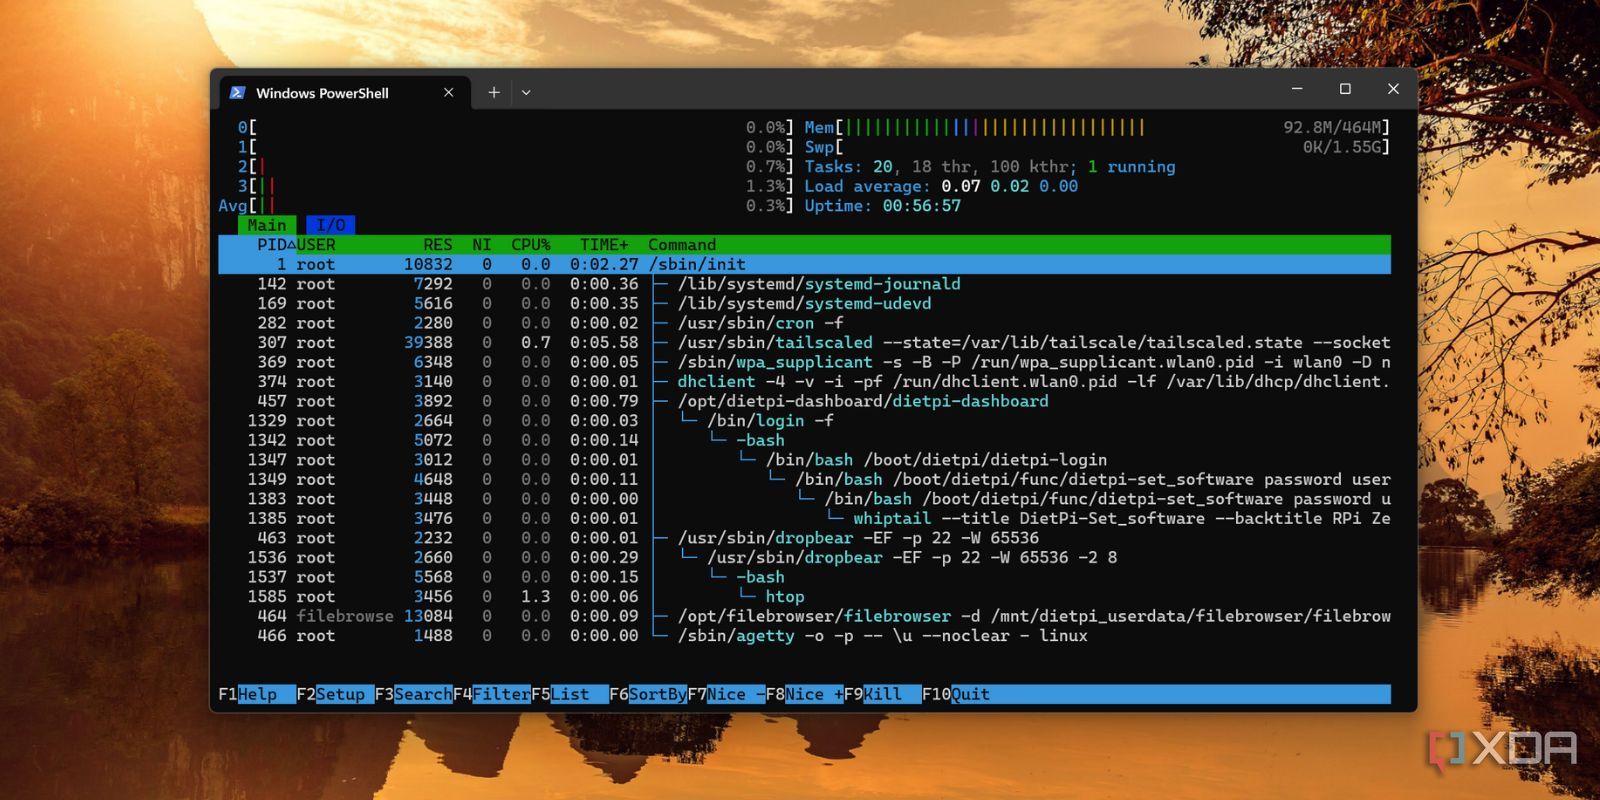
With repeated tries, the situation didn't improve, and the error persisted. I tried rebooting the Pi a few times, hoping that any issues with the service would go away, but it didn't happen. I launched htop to check the services, and it was indeed running. I even doubted conflicting services, but disabling them didn't do anything.
Lastly, I tried the old sudo apt upgrade because a few updates were overdue. After the update, the dashboard URL launched right away. So, always upgrade your machine before or after installing any software. The dashboard asks for a password every time you log in, and it's the same password you use for your machine.
Related
How to update the firmware on Raspberry Pi
Even when you use a Raspberry Pi to serve as a fridge controller or game console, you might need to update the device to keep it working.
A feature-rich dashboard
Statistics, process control, file management, and remote terminal
The terminal greets you with the statistics page, which has a graph section for system diagnostics and a bar representation for core system vitals. It's akin to what you can view in the htop utility in the terminal, but with a better visual representation. You don't need to launch separate tools like you must in the terminal to view CPU, Disk, and RAM utilization on one page.
The dashboard tucks all the options in the left-side menu, where you can switch between tabs. On the top bar, you can toggle between dark and light themes, but the dark one complements the UI.
I tried the Processes tab, and it’s super easy to terminate or kill a process with it. I killed the File Browser process with it, and it disappeared from the list, and the URL wasn’t reachable anymore. However, the same thing didn’t happen with the services window. I manually restart services sometimes, but the services feature didn’t respond as expected. It sometimes hung and went blank, forcing me to log in again to the dashboard or reboot from SSH.
Managing software packages is convenient due to the available installation and uninstallation assistant. The latter worked without any hiccups, while the install feature often encountered problems. Then there’s the Management option, which you can use to quickly access power options and essential details like device IP, architecture, etc. You can force reboot your Pi from here without accessing any terminal via SSH from a PC or even shut it down, if needed.
I can also run the same poweroff and reboot commands directly from the Terminal feature and access other DietPi tools. It’s easy to mount additional disks, configure SSH, access files, and much more from the terminal. I can even run some crucial service and system-related commands from my phone if it’s connected to the same network and doesn’t need a PC to SSH.
DietPi Dashboard also has an integrated file explorer that can access all system files. You can preview and edit most text files, like I modified the dietpi.txt file to stop asking for passwords every time I install something. Similarly, you can create and modify files and folders, and even upload or download one or multiple files using the tool. It cannot preview files like File Browser, but it is excellent for pulling stuff from your Pi and its connected storage drives using a browser.
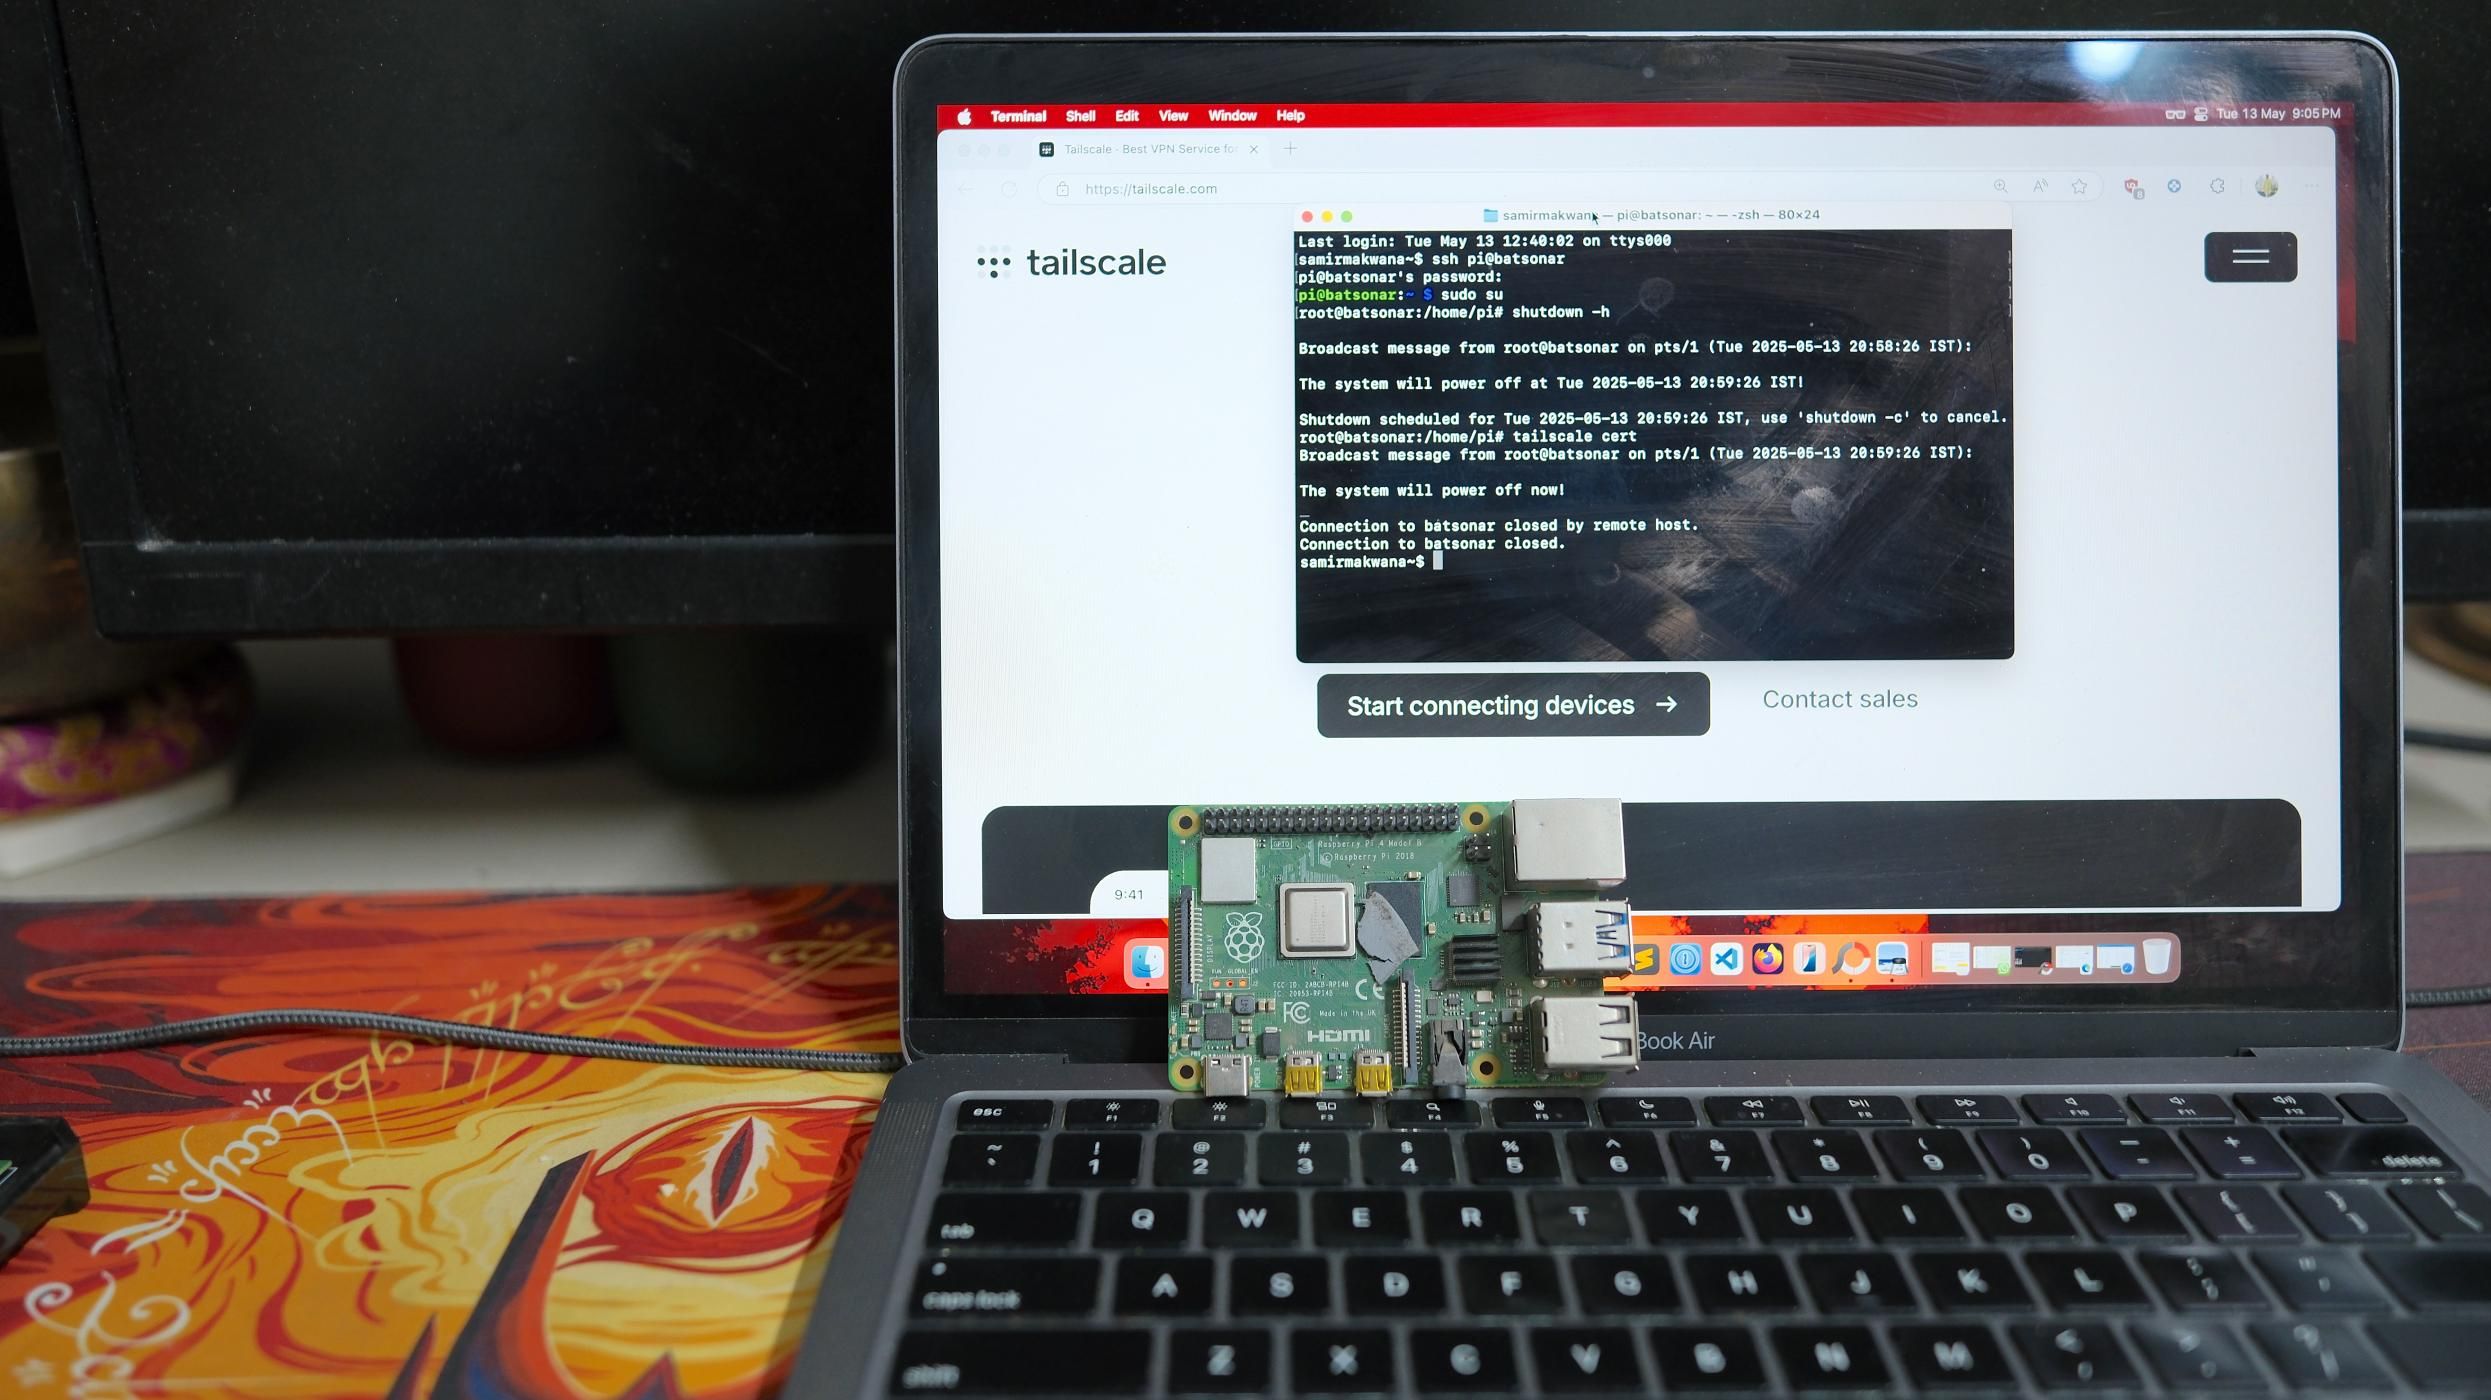
For remote access, I installed Tailscale on the Pi, and now I can access the DietPi dashboard even when I’m outside the local network. Terminal access via phone is a lifesaver in some scenarios when everything else isn’t working or when I want to download a file.
Related
Switch to a GUI dashboard for your DietPi
I appreciate the efforts put into this custom DietPi dashboard, which lends a GUI touch to the otherwise bland command line interface (CLI). It’s lightweight and can easily perform most OS-level tasks. There are a few kinks here and there, but they’re not a deal-breaker because you have an integrated terminal inside the dashboard.


 English (US) ·