.png)
Several features make Obsidian the primary choice for everything, from note-taking to building a personal knowledge management system. The nested folders, the ability to map notes, create multiple vaults, etc. You can even save webpages inside Obsidian now using the Obsidian Web Clipper extension, making it easy for those who refer to online sources when writing or conducting research. Then, there's the ability to install community plugins that let you take complete advantage of Obsidian's abilities. One such plugin that I recently discovered and that has changed the way I use the app is Dataview. It allows you to create visual dashboards inside Obsidian using a few commands.
Initially, I suspected that the procedure would require a lot of effort, and I wasn't willing to dedicate a significant amount of time to getting it to work. Turns out — I was totally wrong. All it needed was to install the plugin and experiment with some lines of code (so that you don't have to). I had a fully functional dashboard ready in just a few minutes. To be fair, I'm not a frequent Obsidian user. I use several apps daily to perform various tasks. However, this new discovery of being able to create my own dashboard might just push me towards using Obsidian more frequently. Here's how I set up my Obsidian dashboard using the Dataview plugin to monitor my tasks, and you can, too.
Related
Installing the plugin and setting up relevant parameters
It only takes a few minutes
Downloading the Dataview plugin is like installing any other extension on Obsidian. Head to the Community plugins section, look for Dataview in the search bar, and install it. Once done, return to the Obsidian home screen and create a new note. You can name it Dashboard or anything of your choice. This is where we'll start creating individual blocks that add value to the dashboard. Before that, though, you may want to add some additional properties to your notes to make them visible in the dashboard.
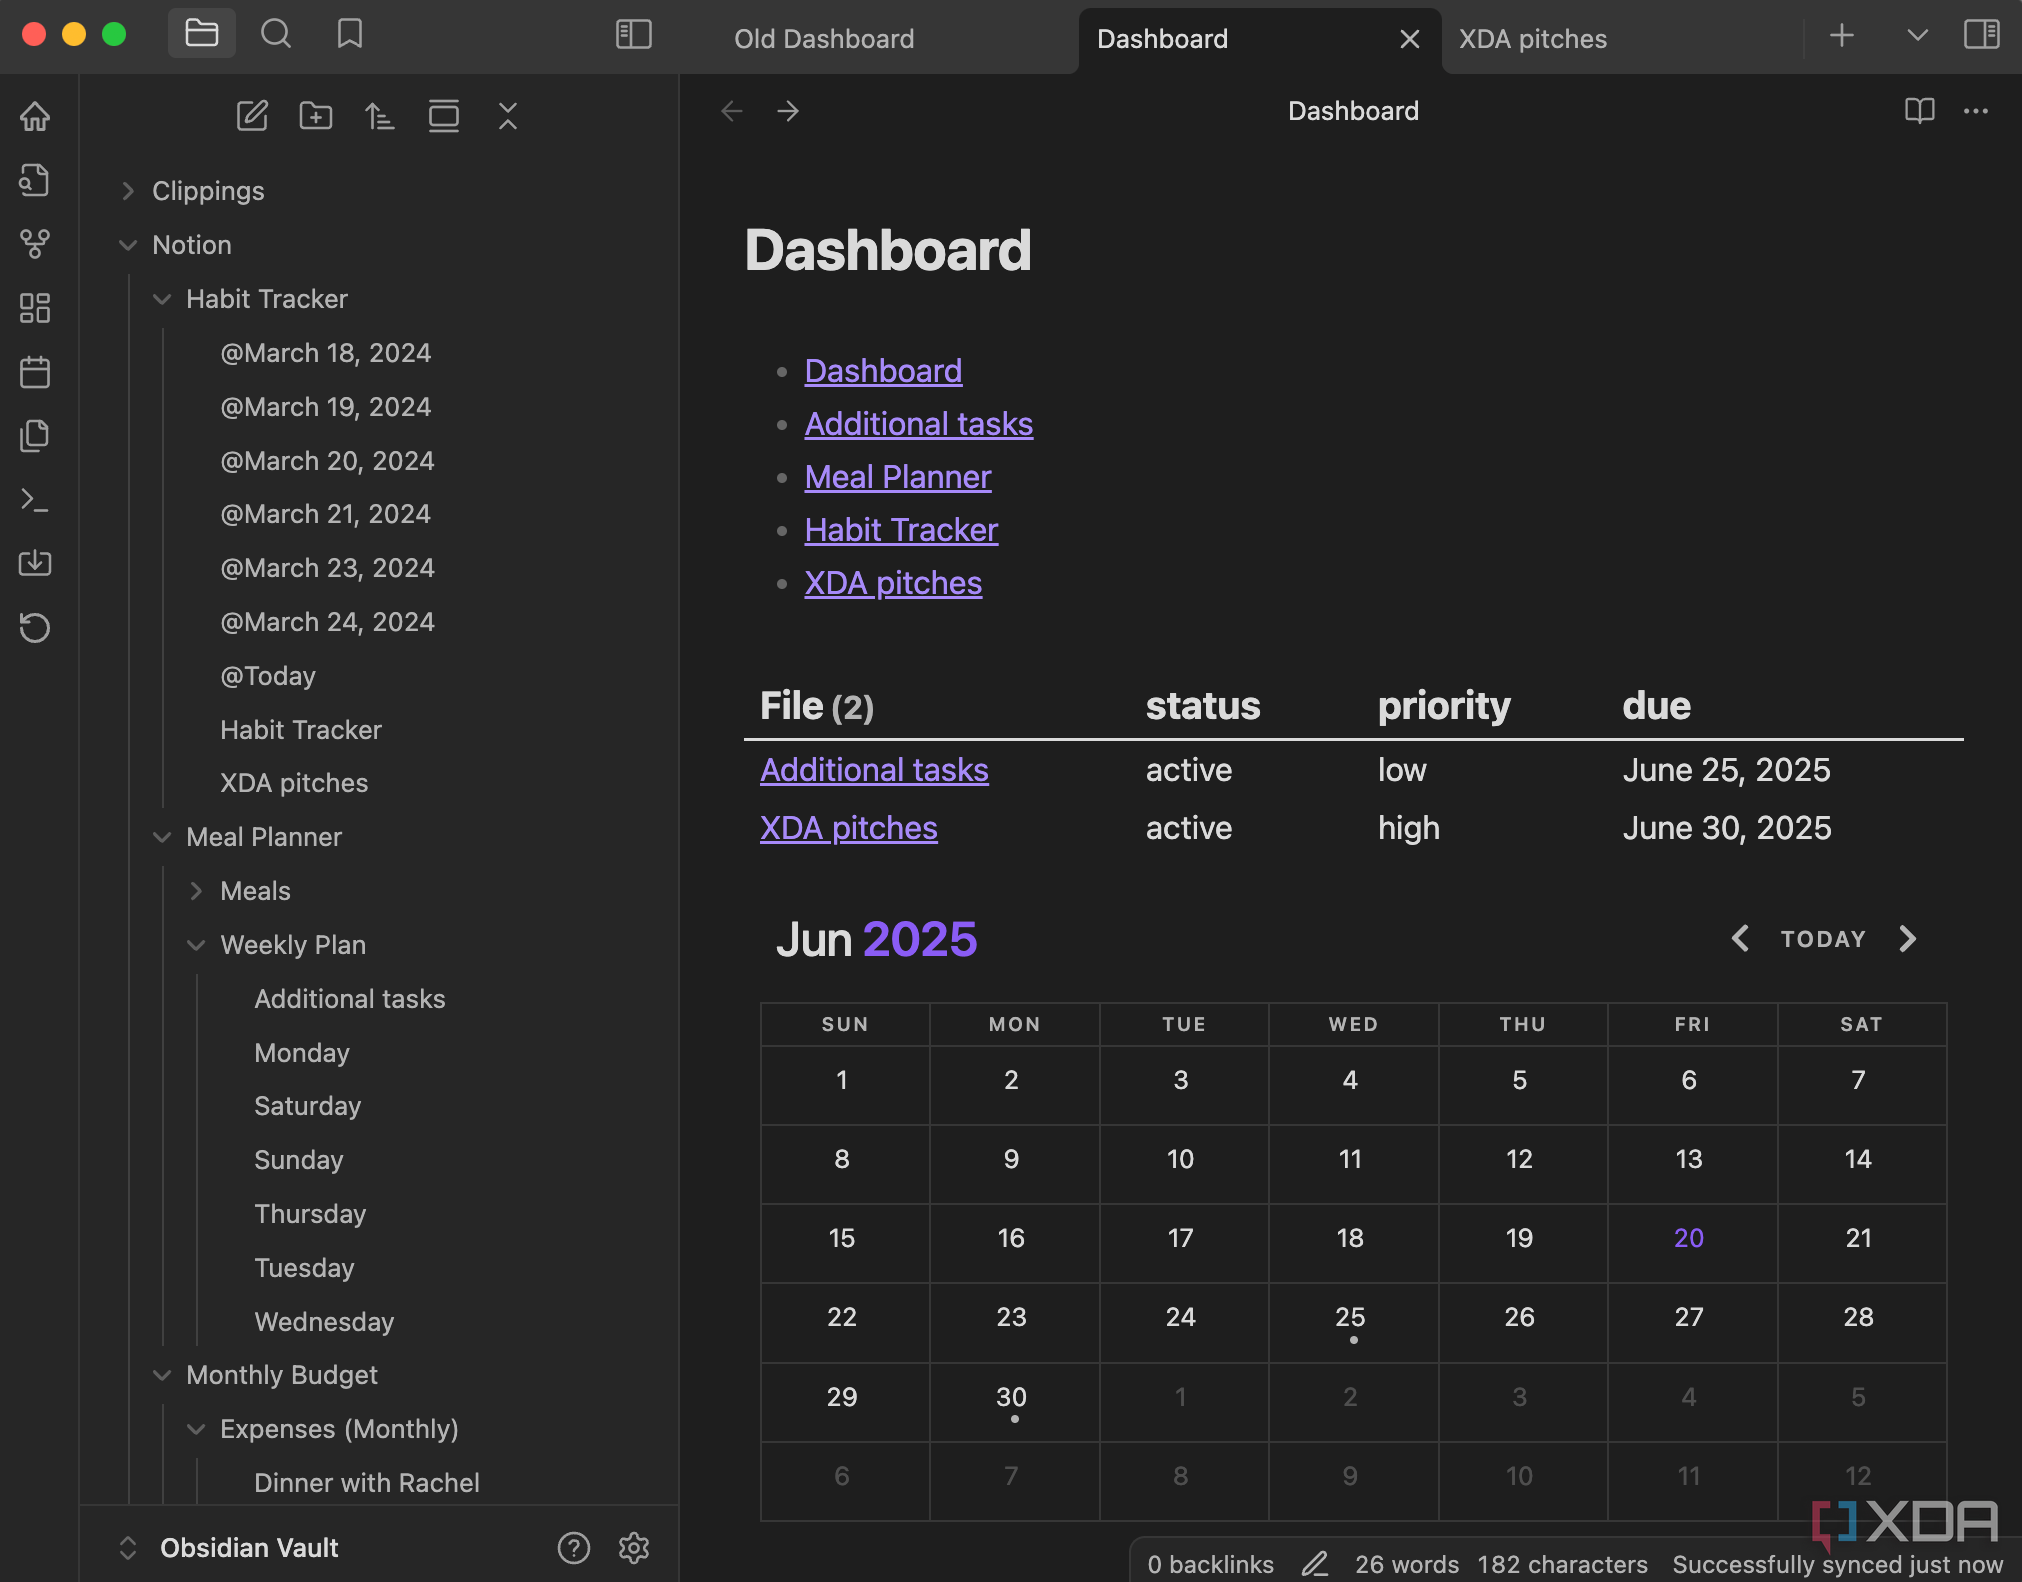
For instance, I created a project status tracking table that displays the name of the project, the priority level, and the due date for easy reference. However, you first need to add these properties to each of your projects so that the plugin can display the relevant parameters. Here's how to do that. First, open each individual note in Obsidian that you want to track the status of. Then, add the following piece of code to the note:
```yamlstatus: active priority: high due: 2025-06-30 tags: project
```
Replace the status, priority, and due fields with their corresponding values depending on the project. If you prefer a Markdown syntax, you can use:
[status:: high] [priority:: high] [due:: 2025-06-30]Once you've added the data to all your projects, we can move to the next step, i.e., creating the dashboard.
Adding elements to the dashboard
Create a customized layout
Switch to the Dashboard note we created earlier. Like any other dashboard, the Dataview plugin allows you to add multiple elements that cater to different requirements. For instance, the first addition to your dashboard could be a list of the five most recently edited notes in your Obsidian vault. This is useful if you're working on multiple documents at once and want to quickly switch between them with a single click. To add it to your dashboard, insert the following:
LISTFROM ""
SORT file.mtime DESC
LIMIT 5
Now, let's create a table of all your projects, their status, and their due date. This will make use of the information you added to all your projects in the previous step. Here's the code to insert:
TABLE status, priority, dueFROM #project
SORT due ASC
If you have too many projects, a table with lots of entries may seem rather intimidating. In such cases, it's a good idea to create a project calendar where your tasks are marked on the dates on which they're due. To create one, use the following code:
CALENDAR dueFROM #project
WHERE due
Similarly, you can also create a progress bar for each task depending on the level of completion using:
const tasks = dv.page("Test").file.taskslet completedTasks = tasks.where(t => t.completed)
dv.span(" * 100) + "/)")
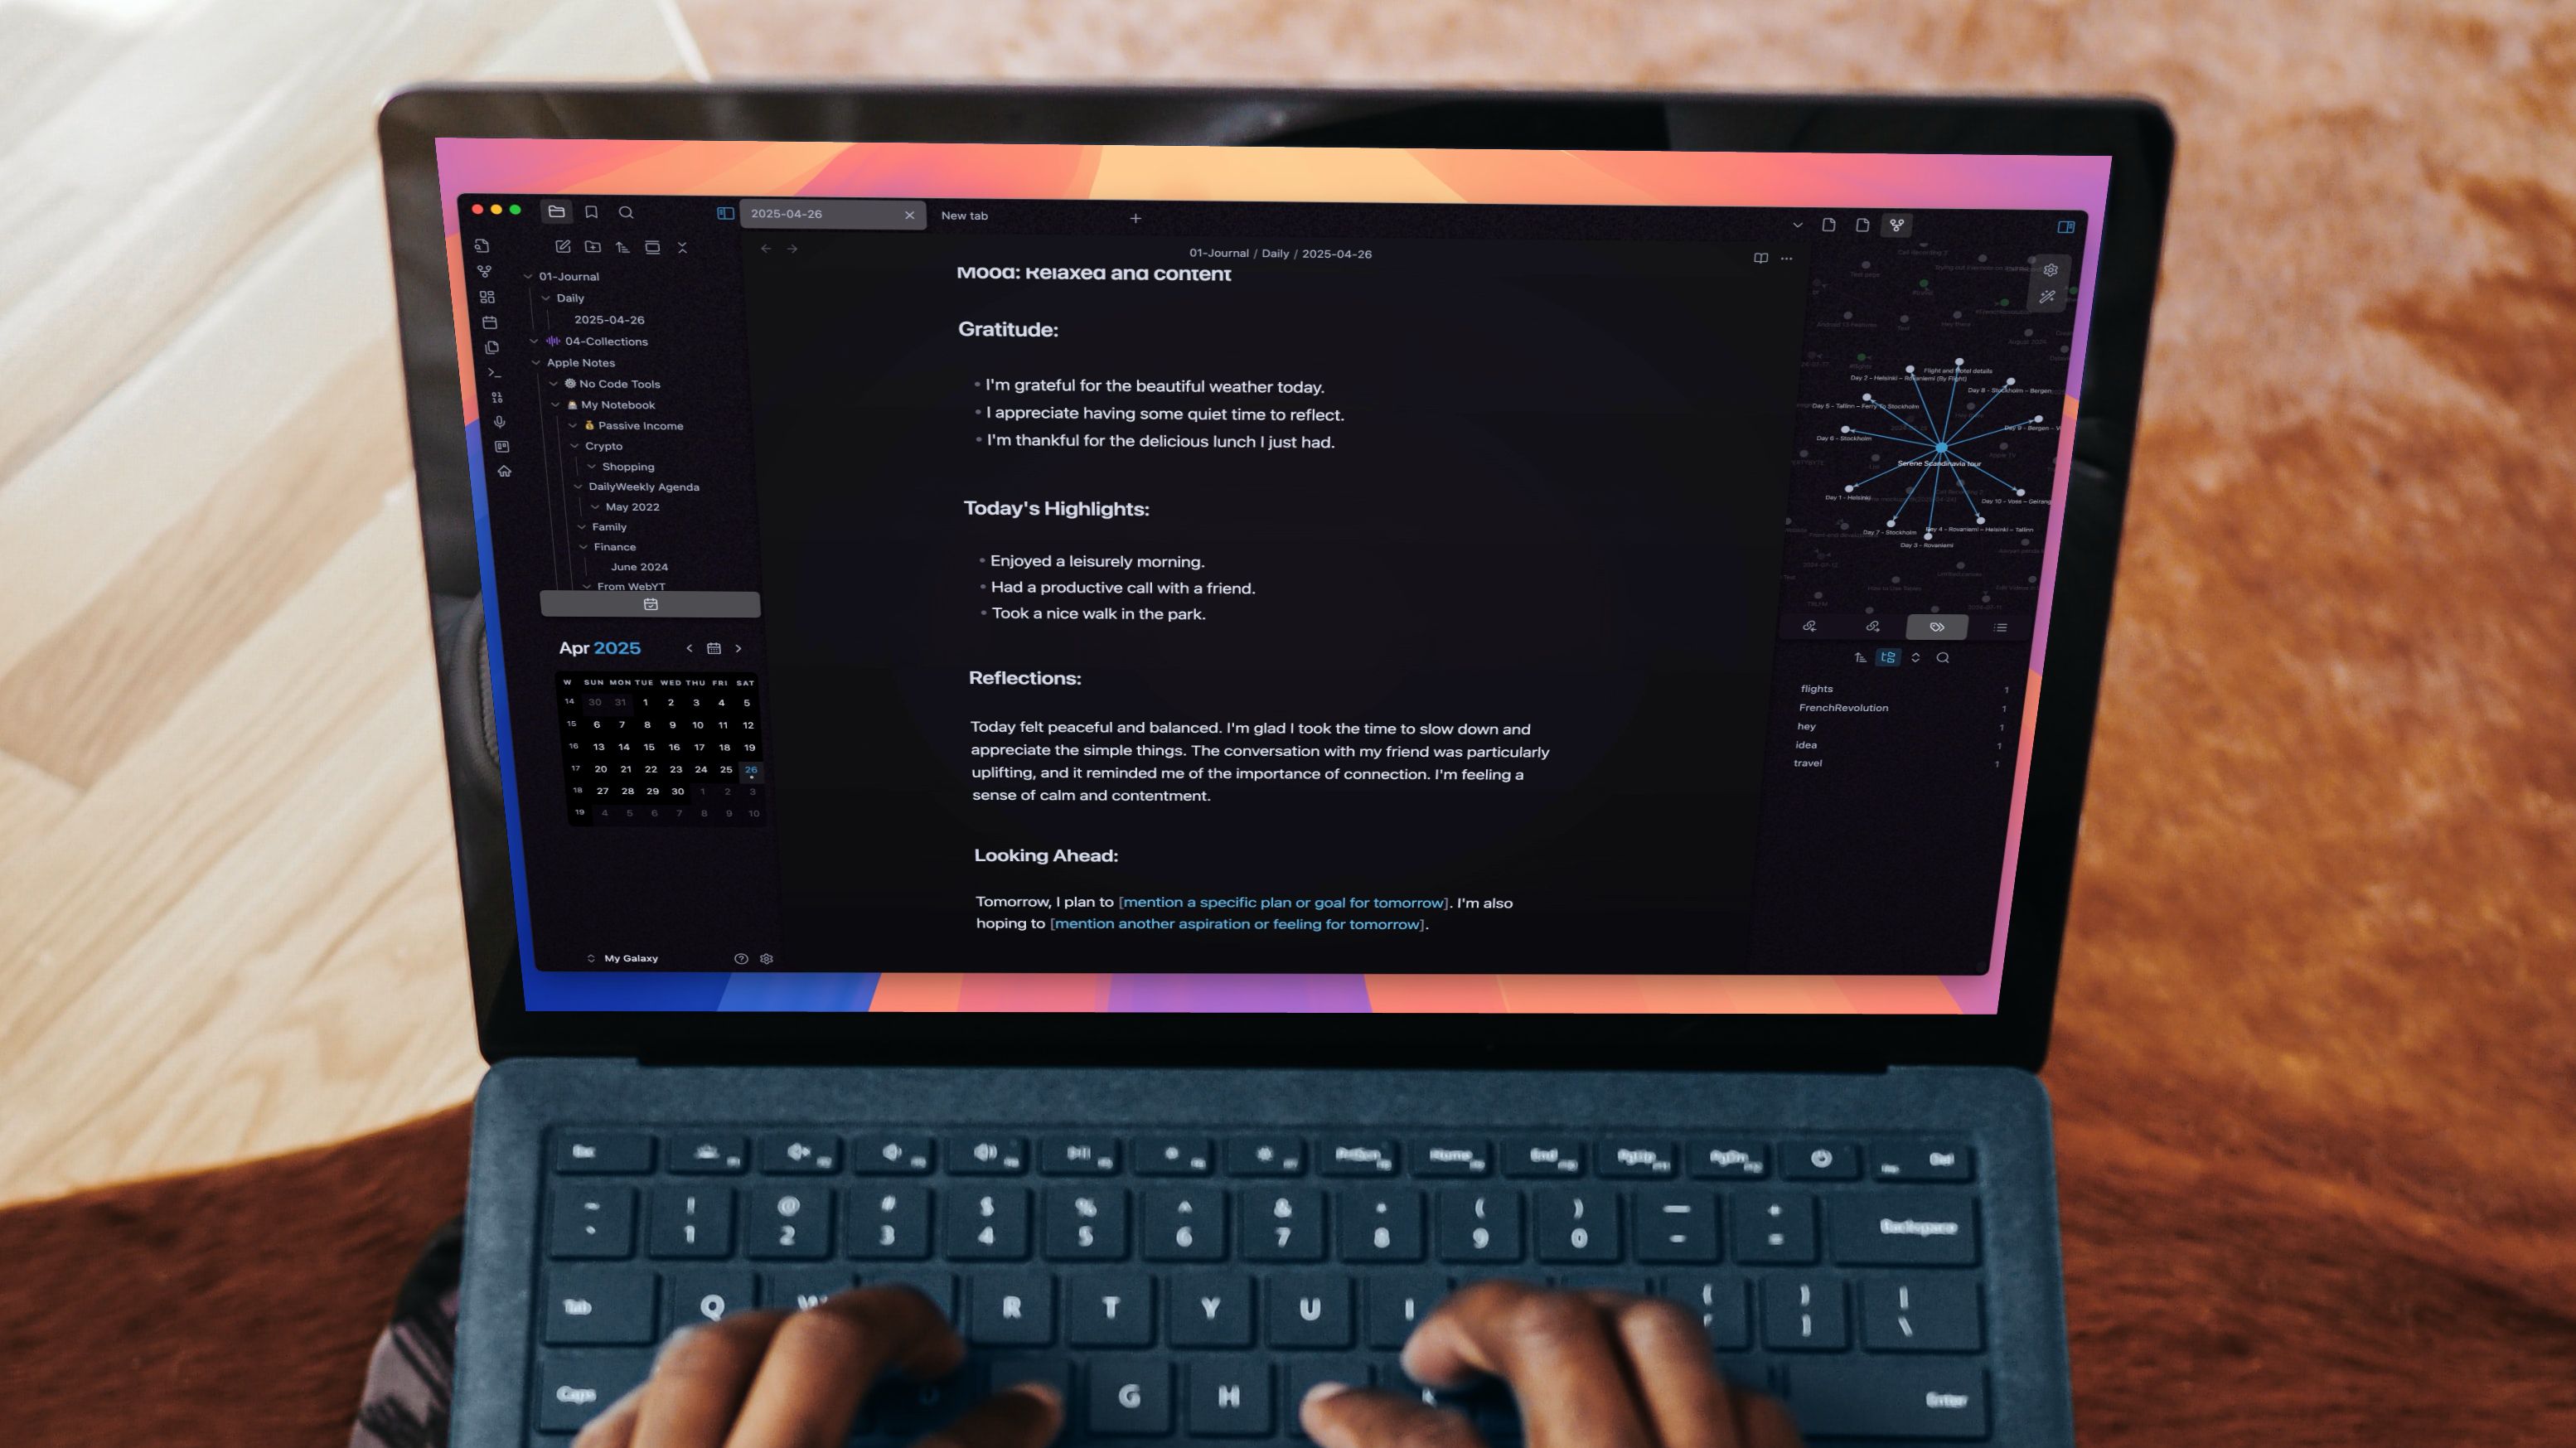
Using these modules as a reference, you can create as many elements as you want to add to your Obsidian dashboard. The end result would be an aesthetically pleasing page that gives you a comprehensive overview of all your tasks, projects, and notes.
Track your progress from a single page
The biggest advantage of creating a customized dashboard is that you can set it up as per your requirements. Whether you wish to track the progress of your projects or you want an overview of all your pending tasks in one place, the Dataview plugin facilitates that without much effort. It's also worth noting that the example mentioned in this post is just the tip of the iceberg. You can achieve several possibilities with the plugin if you know the right parameters to assign and the required syntax to fetch them.
Related
Obsidian canvas and Dataview Plugins to manage complex projects visually — here's how
How Obsidian helped me build a visual, metadata-powered workflow that matches how I think.


 English (US) ·