.png)

Maker, meme-r, and unabashed geek, Joe has been writing about technology since starting his career in 2018 at KnowTechie. He's covered everything from Apple to apps and crowdfunding and loves getting to the bottom of complicated topics. In that time, he's also written for SlashGear and numerous corporate clients before finding his home at XDA in the spring of 2023.
He was the kid who took apart every toy to see how it worked, even if it didn't exactly go back together afterward. That's given him a solid background for explaining how complex systems work together, and he promises he's gotten better at the putting things back together stage since then.
Managing a home lab of any size soon gets tricky, as data gets sprawled across multiple dashboards. That makes visibility into your containers, servers, hypervisors, and the ilk tricky, as you have to log in to several services, remember the layout of each, and deal with other cognitive loads. It's honestly a lot, and I can see why some people would be put off from self-hosting and home lab experiments, but I'm here to say that it doesn't have to be this way.
After adding one network monitoring tool to my critical infrastructure, I can monitor everything from one dashboard that shows more information than the built-in dashboards for my existing services. It's called Netdata, and it's already given me a wealth of important insights about my home lab that I hadn't noticed.
What is Netdata, and why would you want to use it?
Network visibility is key to high availability and troubleshooting
Imagine you've started out building a home lab, and have a couple of Docker containers running in a Linux VM. Things snowball, and before you know it, you're scouring eBay for ex-enterprise HBAs to add more and more SATA storage to your cobbled-together server. Before you get to the stage of having multiple servers, dozens of VMs, and running operating systems, knowing how you will keep track of it all is essential. I don't mean physically, but that helps too, but what software will pull in metrics from those different sources to give you visibility over the whole.
We've tested many monitoring dashboards over the years, from Glance, which is lightweight and simple to set up, to industry standards like Zabbix. The problem is, most easy-to-set-up solutions are limited in scope, while the industry ones have a steep learning curve that's not for the faint of heart.
That changed when I saw Netdata while browsing Reddit in the morning over coffee. Okay, not right while I was browsing, that would be silly. But I was intrigued enough to go see where I could install it, and a short CLI command in my Proxmox hypervisor had me off and running.
Netdata has integrations for our favorite home lab tools and operating systems, like TrueNAS and Proxmox VE.
I won't even attempt to put every Netdata integration down here, because there are hundreds. But here are some notables from scanning the list:
- Windows
- Proxmox (both hypervisor and containers)
- Kubernetes
- Linux
- OpenBSD
- Systemd services
- CUPS
- DNS servers
- UPS batteries
I could find almost everything I run in my home lab, except for a native integration to Synology DSM, but I expected that. That can be handled with a Docker container, so that shouldn't be a stumbling block. With five nodes (devices or services), it's free to start with, and $90 a year for unlimited nodes, metrics, etc. for home lab users. It's great to see a company with a special home lab tier like this, where so many monitoring services crank up the pricing once you hit the limit of the free offering.
 Credit: Source: Netdata
It's really easy to set up
And works in many places you are probably already using
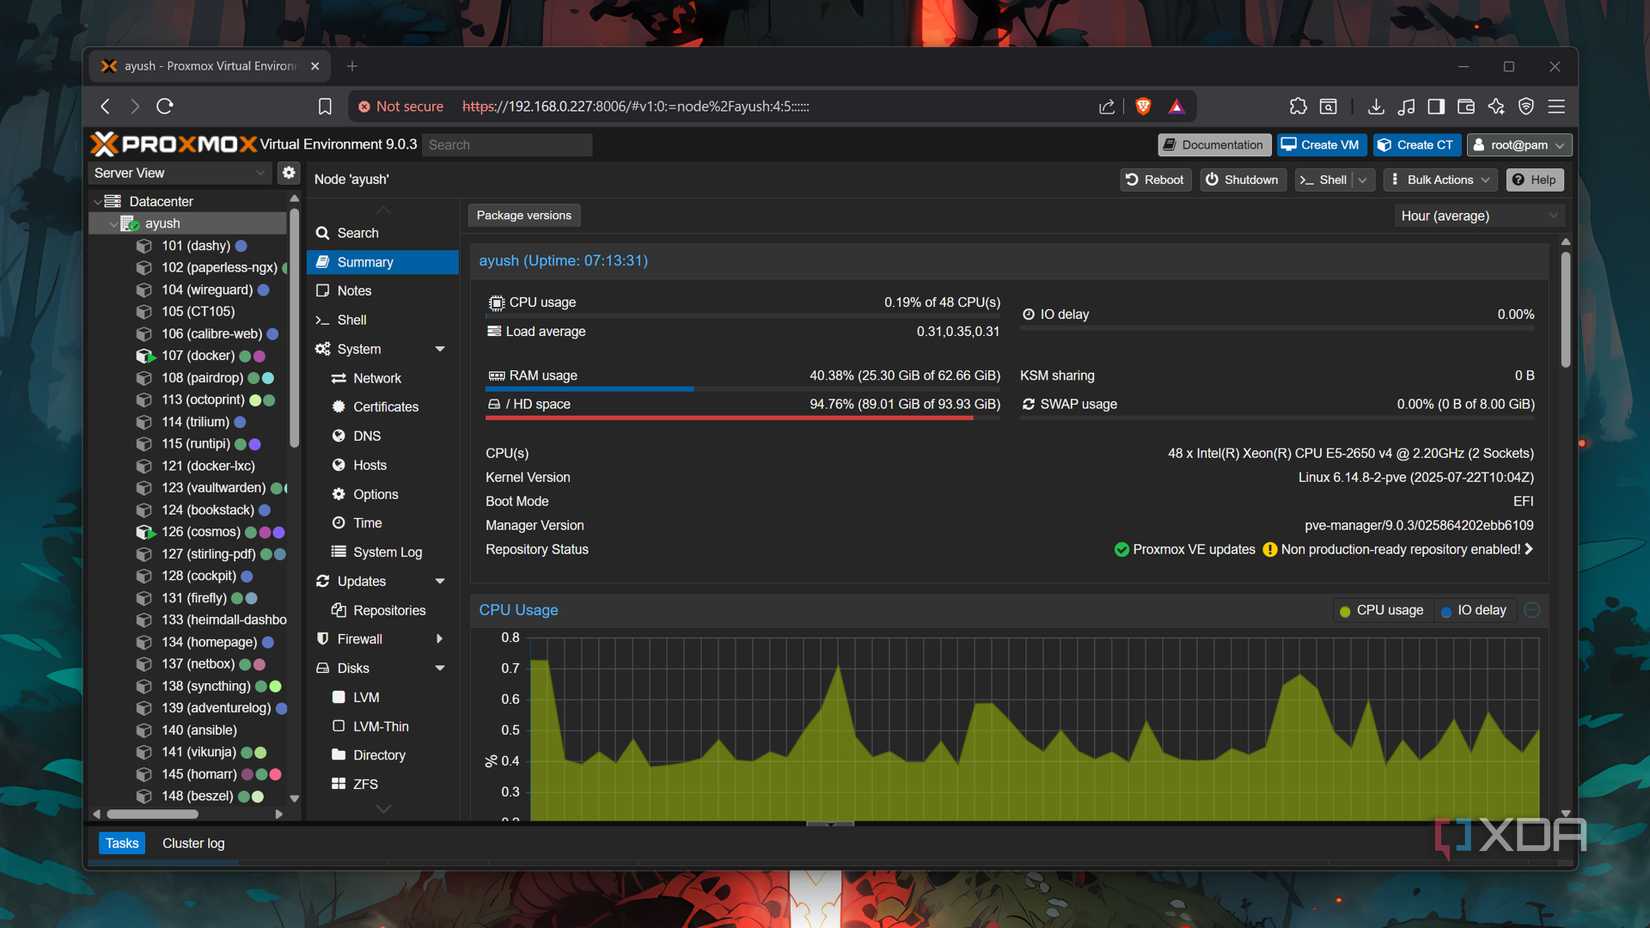
The worst part of setting up any monitoring tool for me is that I usually have to figure out what metrics are being measured, how to pull them in, and how to display them. Netdata takes all of that pain away from me, with automatic detection and discovery of everything on the nodes it's running on. I found things on my Proxmox VE node that I didn't even know were running, because they're not immediately visible on the native dashboard.
All it took was a single CLI command (token-goes-here and room-goes-here had the Netdata keys in the command I ran):
wget -O /tmp/netdata-kickstart.sh https://get.netdata.cloud/kickstart.sh && sh /tmp/netdata-kickstart.sh --stable-channel --claim-token token-goes-here --claim-rooms room-goes-here --claim-url https://app.netdata.cloudIt honestly took longer to create a Netdata account than it did to connect to my first node, and I appreciate that in a monitoring tool. I shouldn't have to spend days setting it up, it should just work so I can get on with deciding which pieces of data I need to check.
There's also a handy community script for Proxmox VE to add Netdata as an LXC container or directly into the OS install. If you're already monitoring your Proxmox server using the Prometheus PVE Exporter project, which also works with Netdata,you can choose which dashboards you want to use.
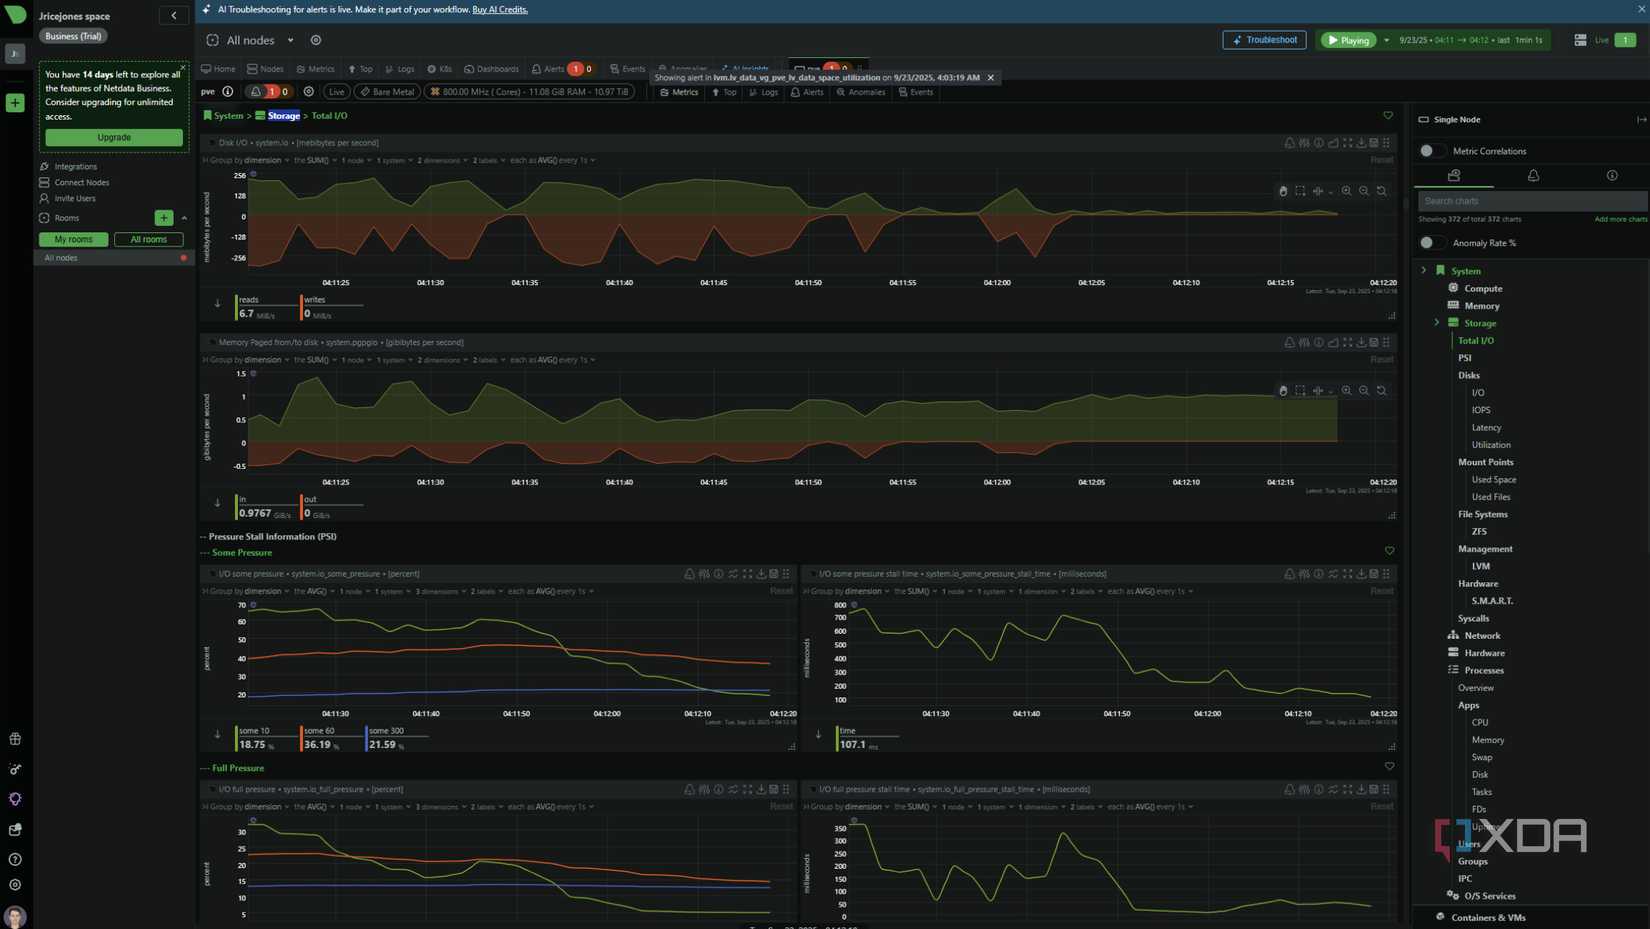
And immediately, it flagged two problems to fix, both with LVM storage space getting close to full. I had worried this might happen because I used a 64GB partition for Proxmox's install, but I thought I'd have enough storage by moving cache and logging to the ZFS pools. I was wrong, apparently, and the data doesn't lie.
Thankfully, I don't have many things running on that instance yet, so it'll be a simple case of moving VMs to the NAS, reinstalling Proxmox on the NVMe drives in that machine, and copying things back. Or maybe I'll set up Proxmox Backup Server on the NAS first, so I can practice that and run it when everything is fixed from my snafu.
Netdata lets me visualize what's going on in all my services in one place
The other thing I like about Netdata is that it's cloud based. Normally, I'd rather self-host things, but when it's going to be monitoring my OPNsense routers, servers, and other network devices, I think I'd rather have it off-site so that any issues with my physical hardware can be monitored. Otherwise, I'd have blank dashboards if something goes dark, which feels antithetical to the whole point of monitoring.


 English (US) ·