.png)
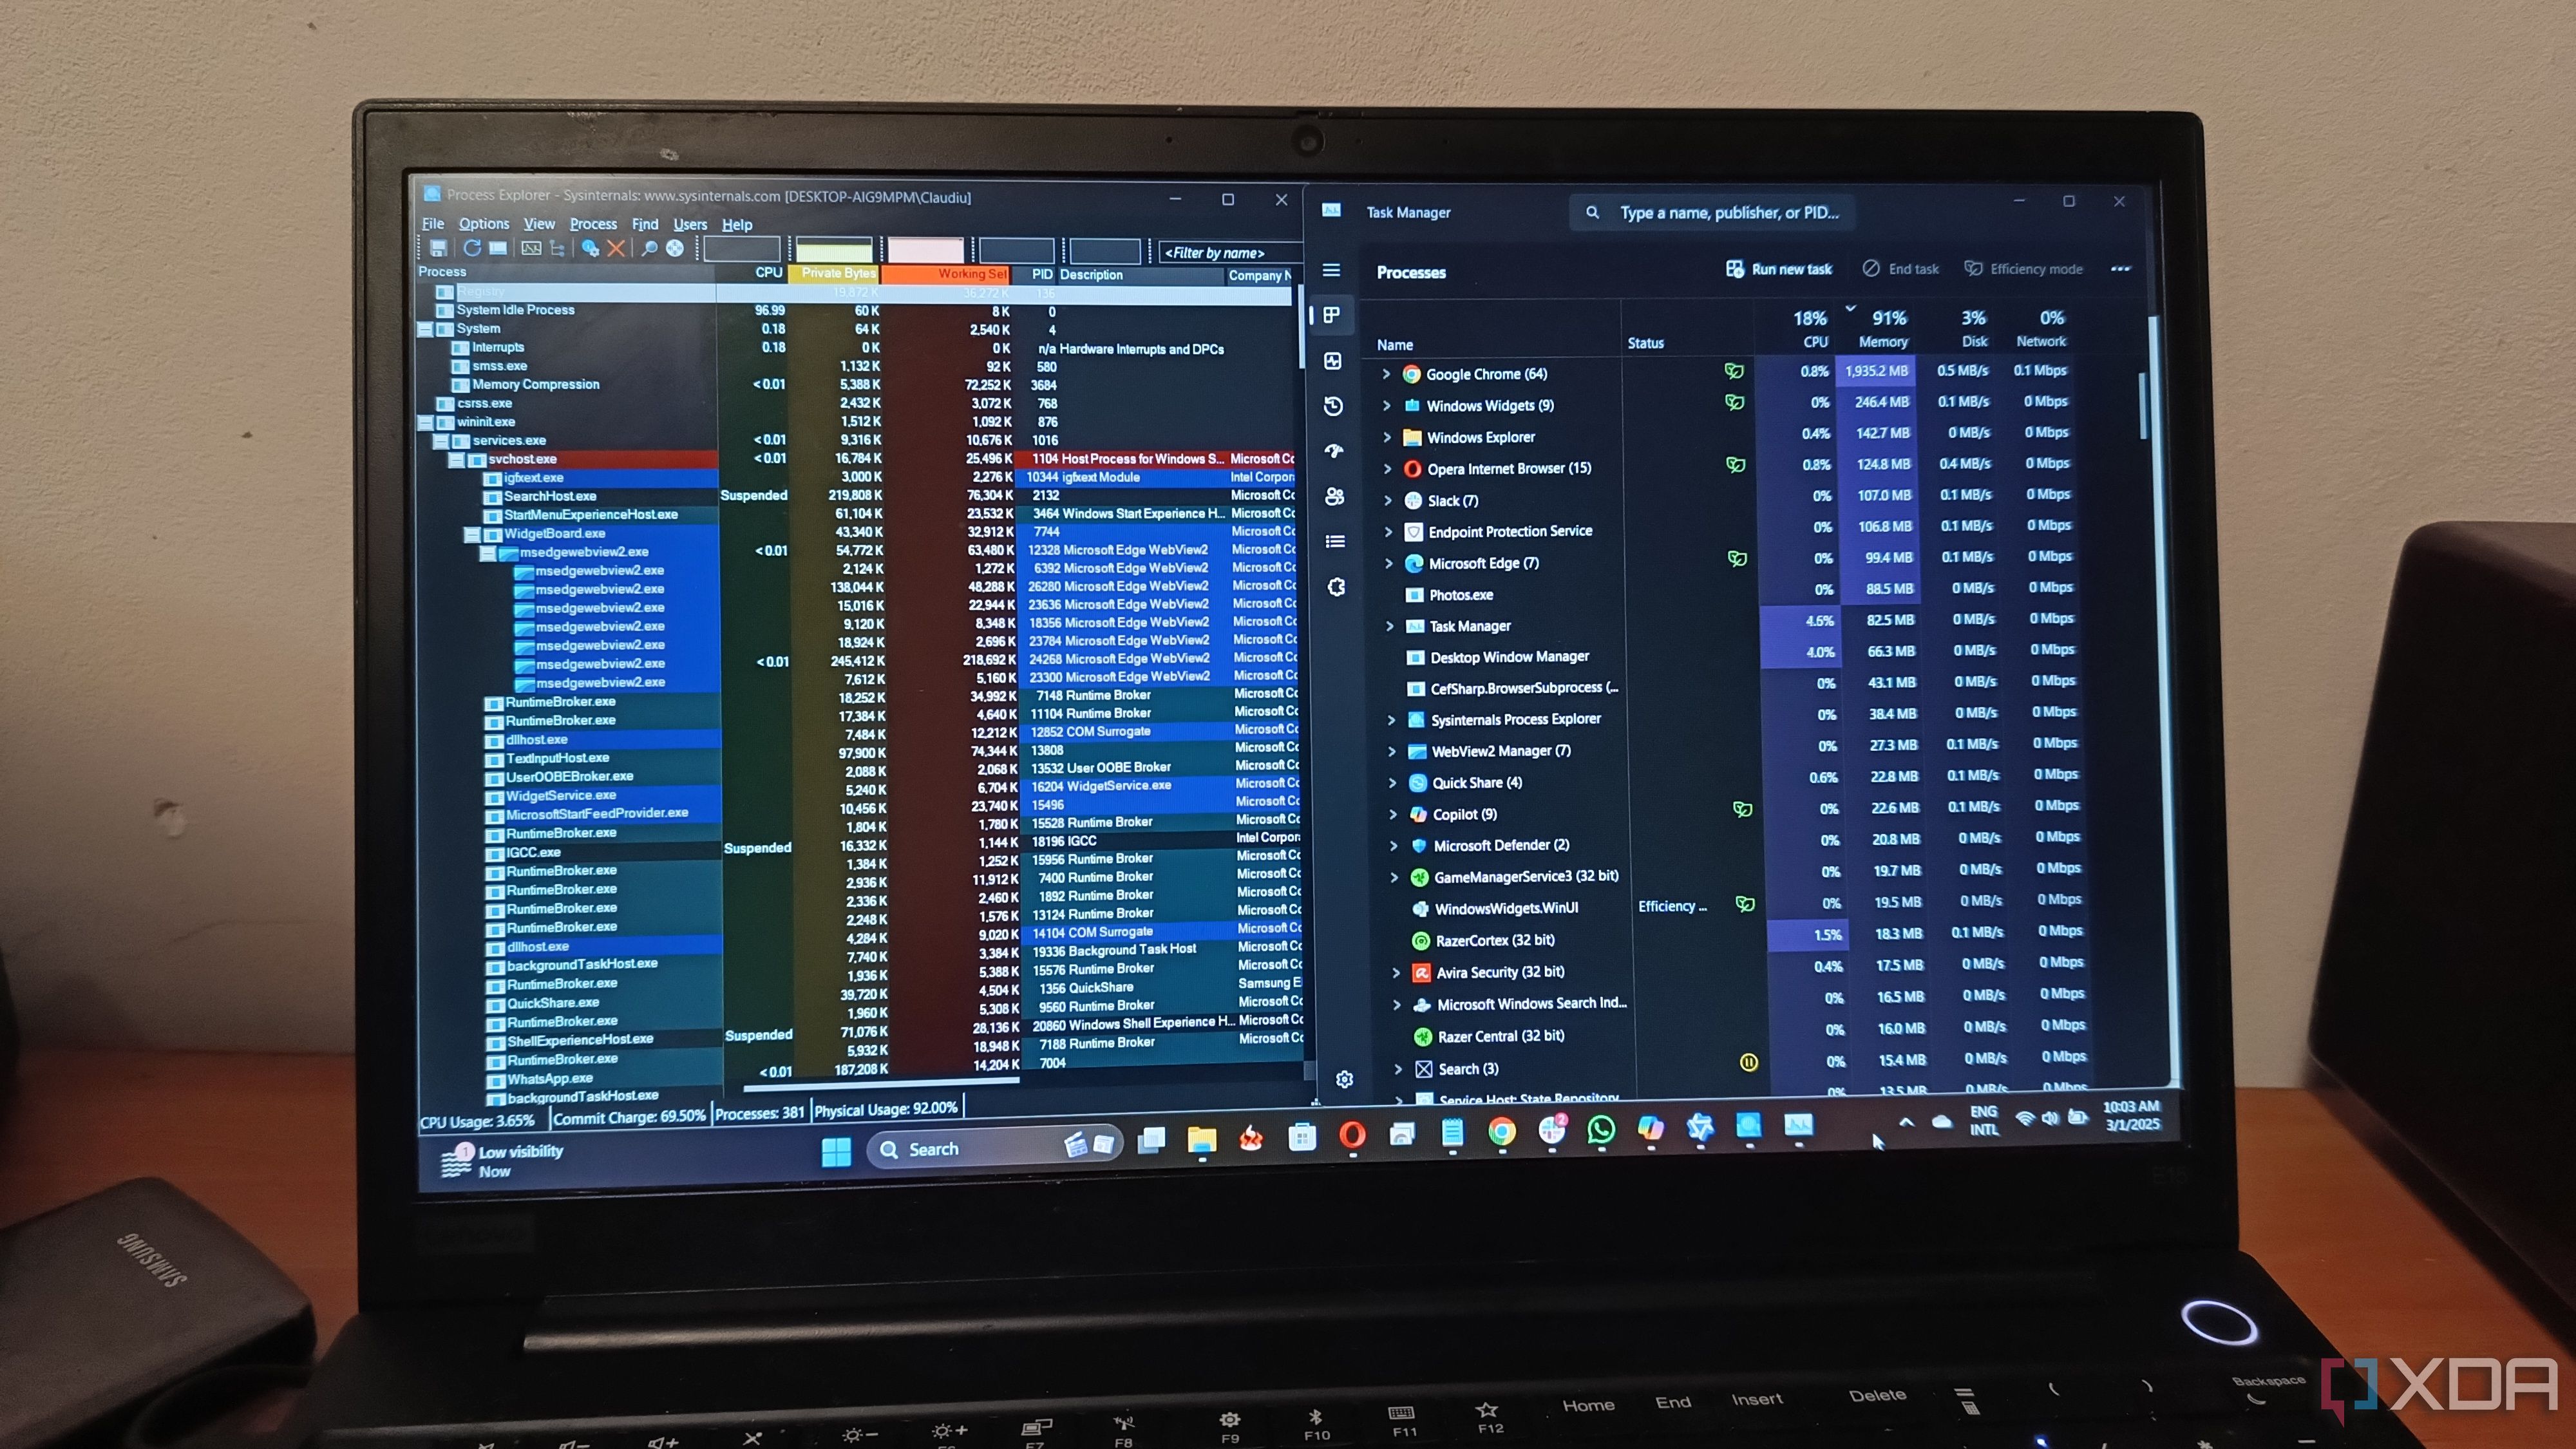
Ensuring that your system is running smoothly and as expected is important in order to be able to keep doing your work efficiently. Windows comes with a few tools that help you stay on top of these performance metrics, including Task Manager, which I'm sure almost any Windows 11 user is familiar with.
But there's another tool you might not know about or checked out before: Performance Monitor. This advanced tool in Windows lets you closely monitor all kinds of activity on your PC, so you can ensure everything is working as intended and spot potential processes and tasks interfering with your system's performance.
Related
Detailed performance counters
So much to read into
There are many components to Performance Monitor, but the main one you'll probably be drawn to right away is the Performance Monitor in itself. This graph can show you real-time information about your computer's resource usage and performance over a specific period of time, which you can also customize.
By default, the Performance Monitor graph will show data for the last couple of minutes, and it only includes one line, representing the processor time. However, you can add a ton more counters to this graph, which makes it way more impressive and useful.
These counters include a ton of options, such as battery status, BitLocker information, Bluetooth and network adapters, and so much more. There are more options here than you'll probably know what to do with, but complexity isn't always a negative. If you need detailed information about any part of your PC, this is the place to find it and see what's making it tick.
You can choose between a line graph and a histogram to visualize the usage of the different counters you selected, as well as viewing logs.
Related
Multiple graphs at the same time
Always ready to analyze different aspects
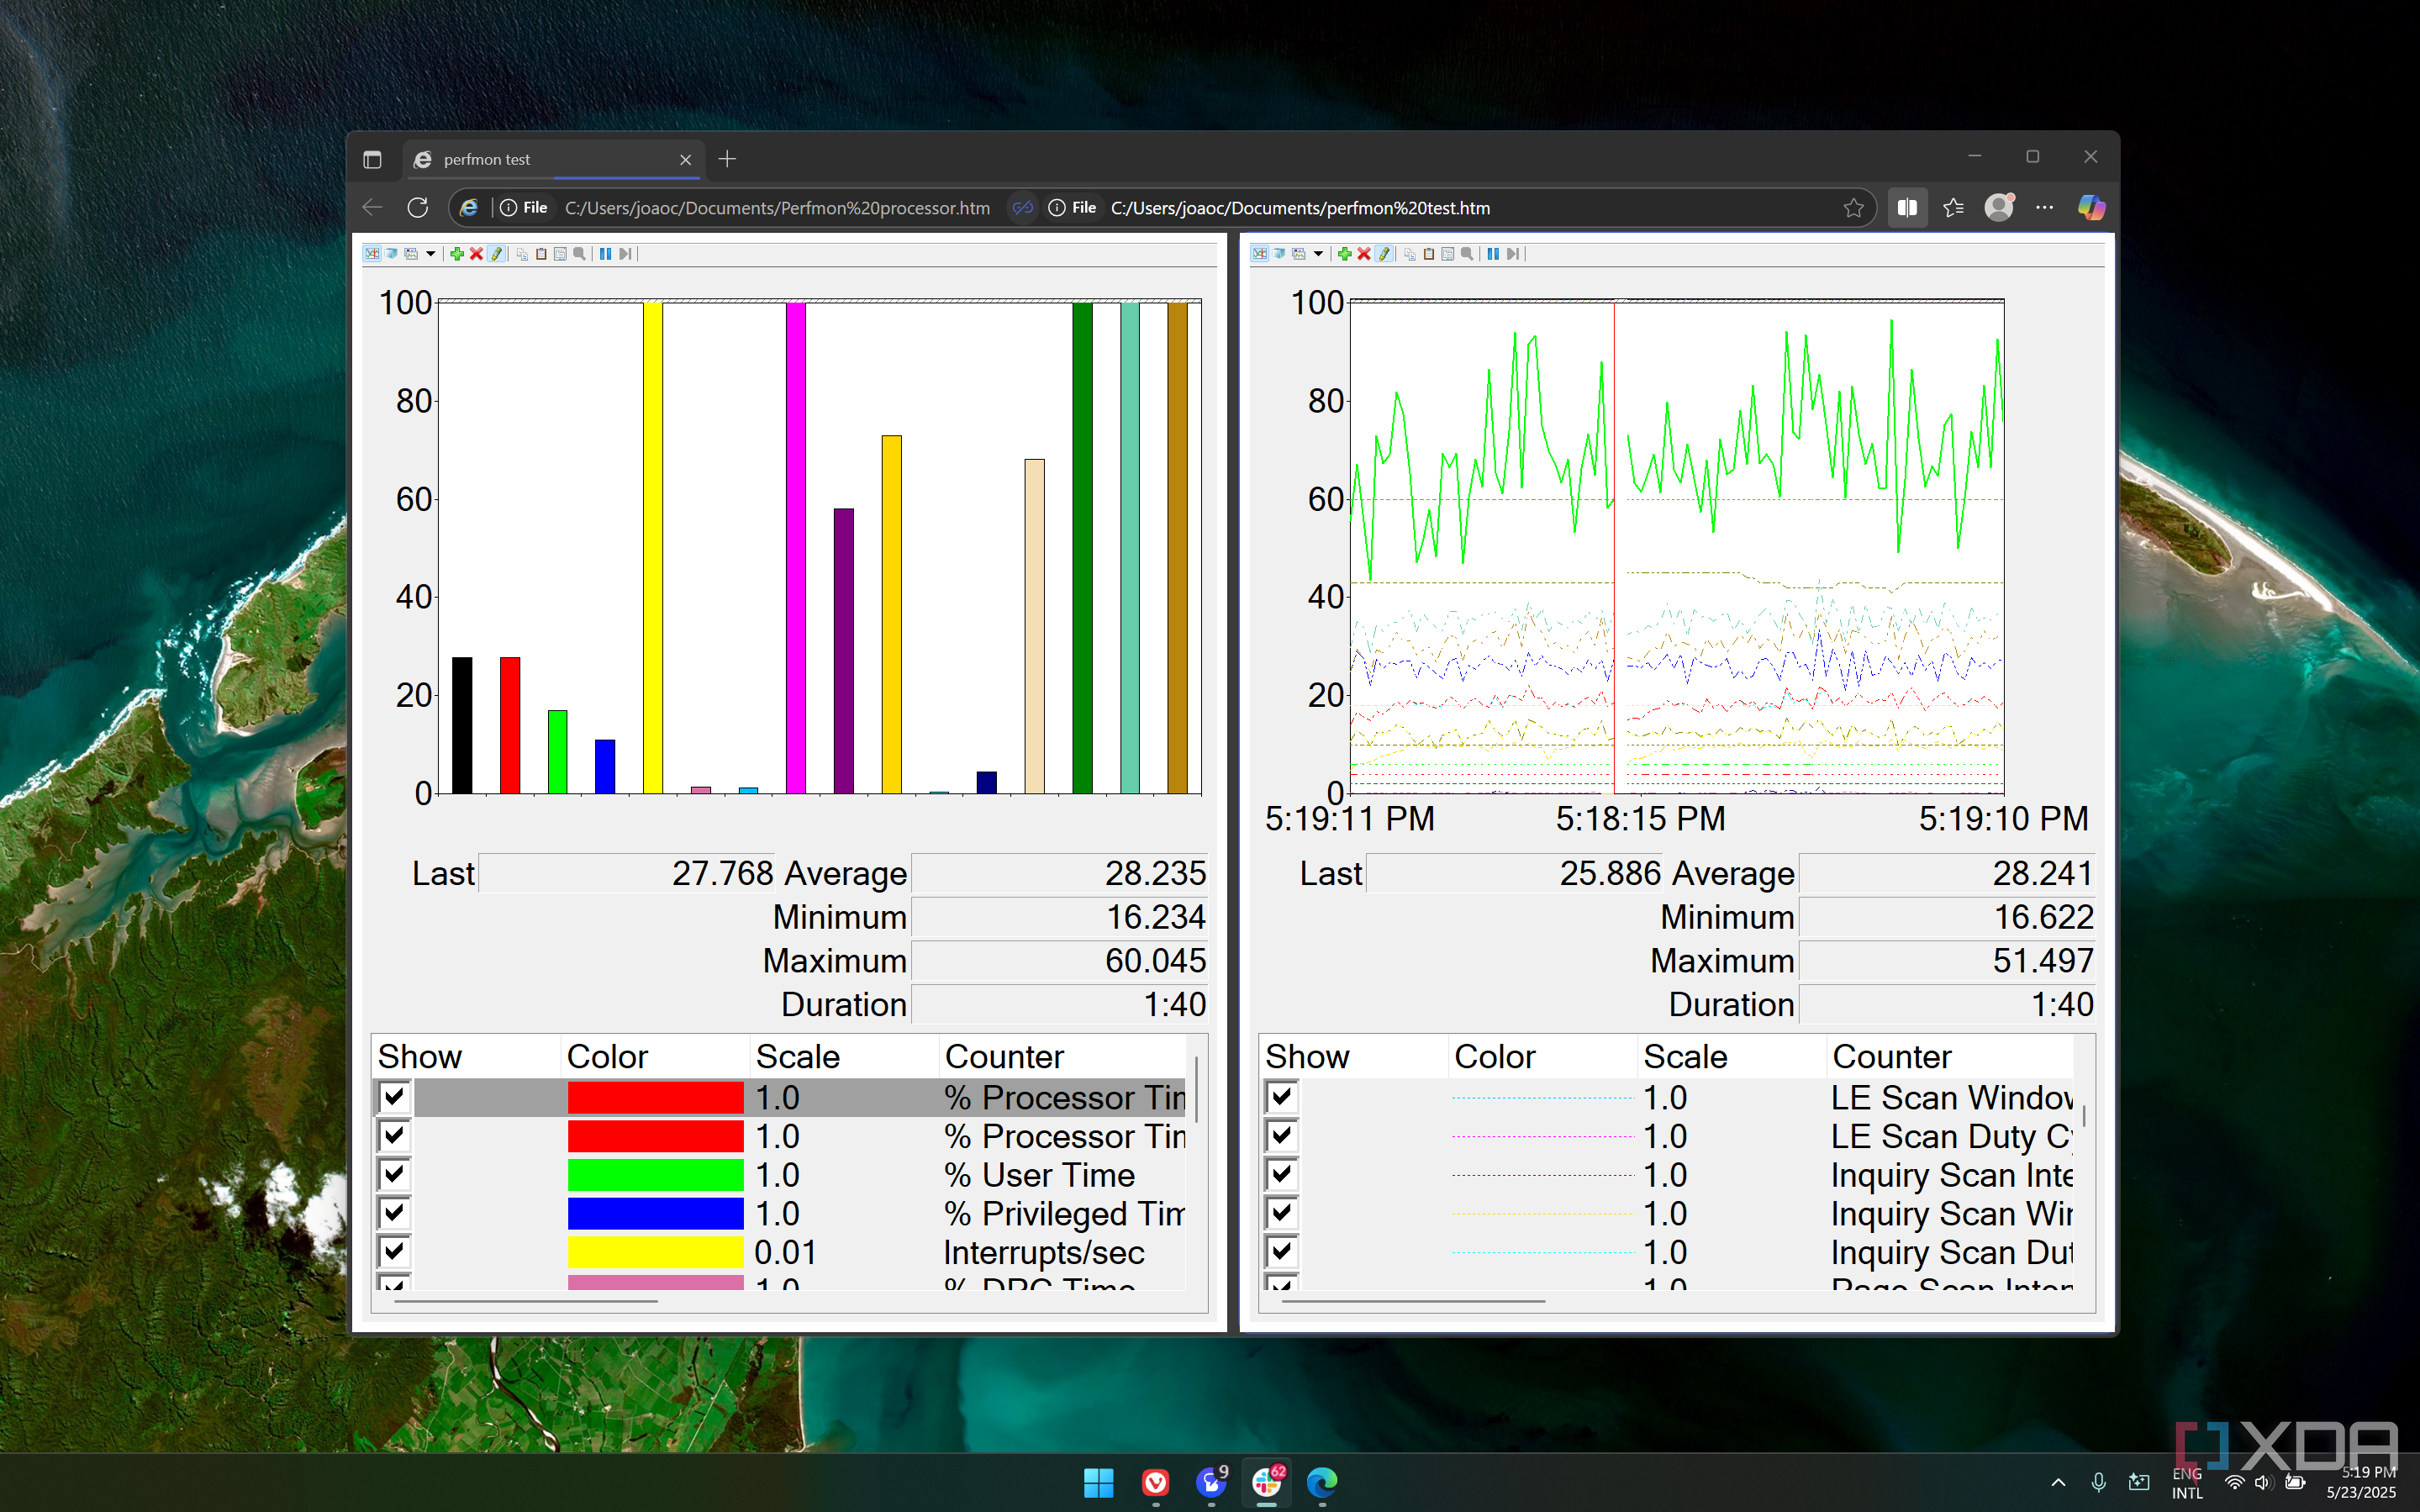
The number of counters available in Performance Monitor is in the hundreds, and you can make them all visible at once, but that's probably not going to work the best if you want the data to be readable. Thankfully, Performance Monitor lets you save a specific set of settings as an HTM file, and you can then open it in Microsoft Edge to view the monitor for the specific set of information you selected.
This used to be a more useful feature, but in Windows 11, it looks like the ability to load specific settings no longer works properly. This feature in Performance Monitor was designed around Internet Explorer, and while you can still open the file in Microsoft Edge by enabling IE Mode, it won't load all the counters you added originally. However, because the entire graph interface is loaded within the browser, you can still manually add the counters again, and having a browser like this makes it possible to open multiple graphs at the same time and used them to monitor different things. It's unfortunate you need to set it up manually each time, but at least it still works.
You could also just open multiple instances of performance monitors, but using Edge means you can have each monitor in a separate tab within the same window, or even use the split screen view to have more monitors immediately visible at once.
Related
7 apps that could be slowing your Windows performance
Is your Windows laptop feeling sluggish? These seven apps could be affecting performance.
It can generate detailed reports, too
Beyond real-time monitoring
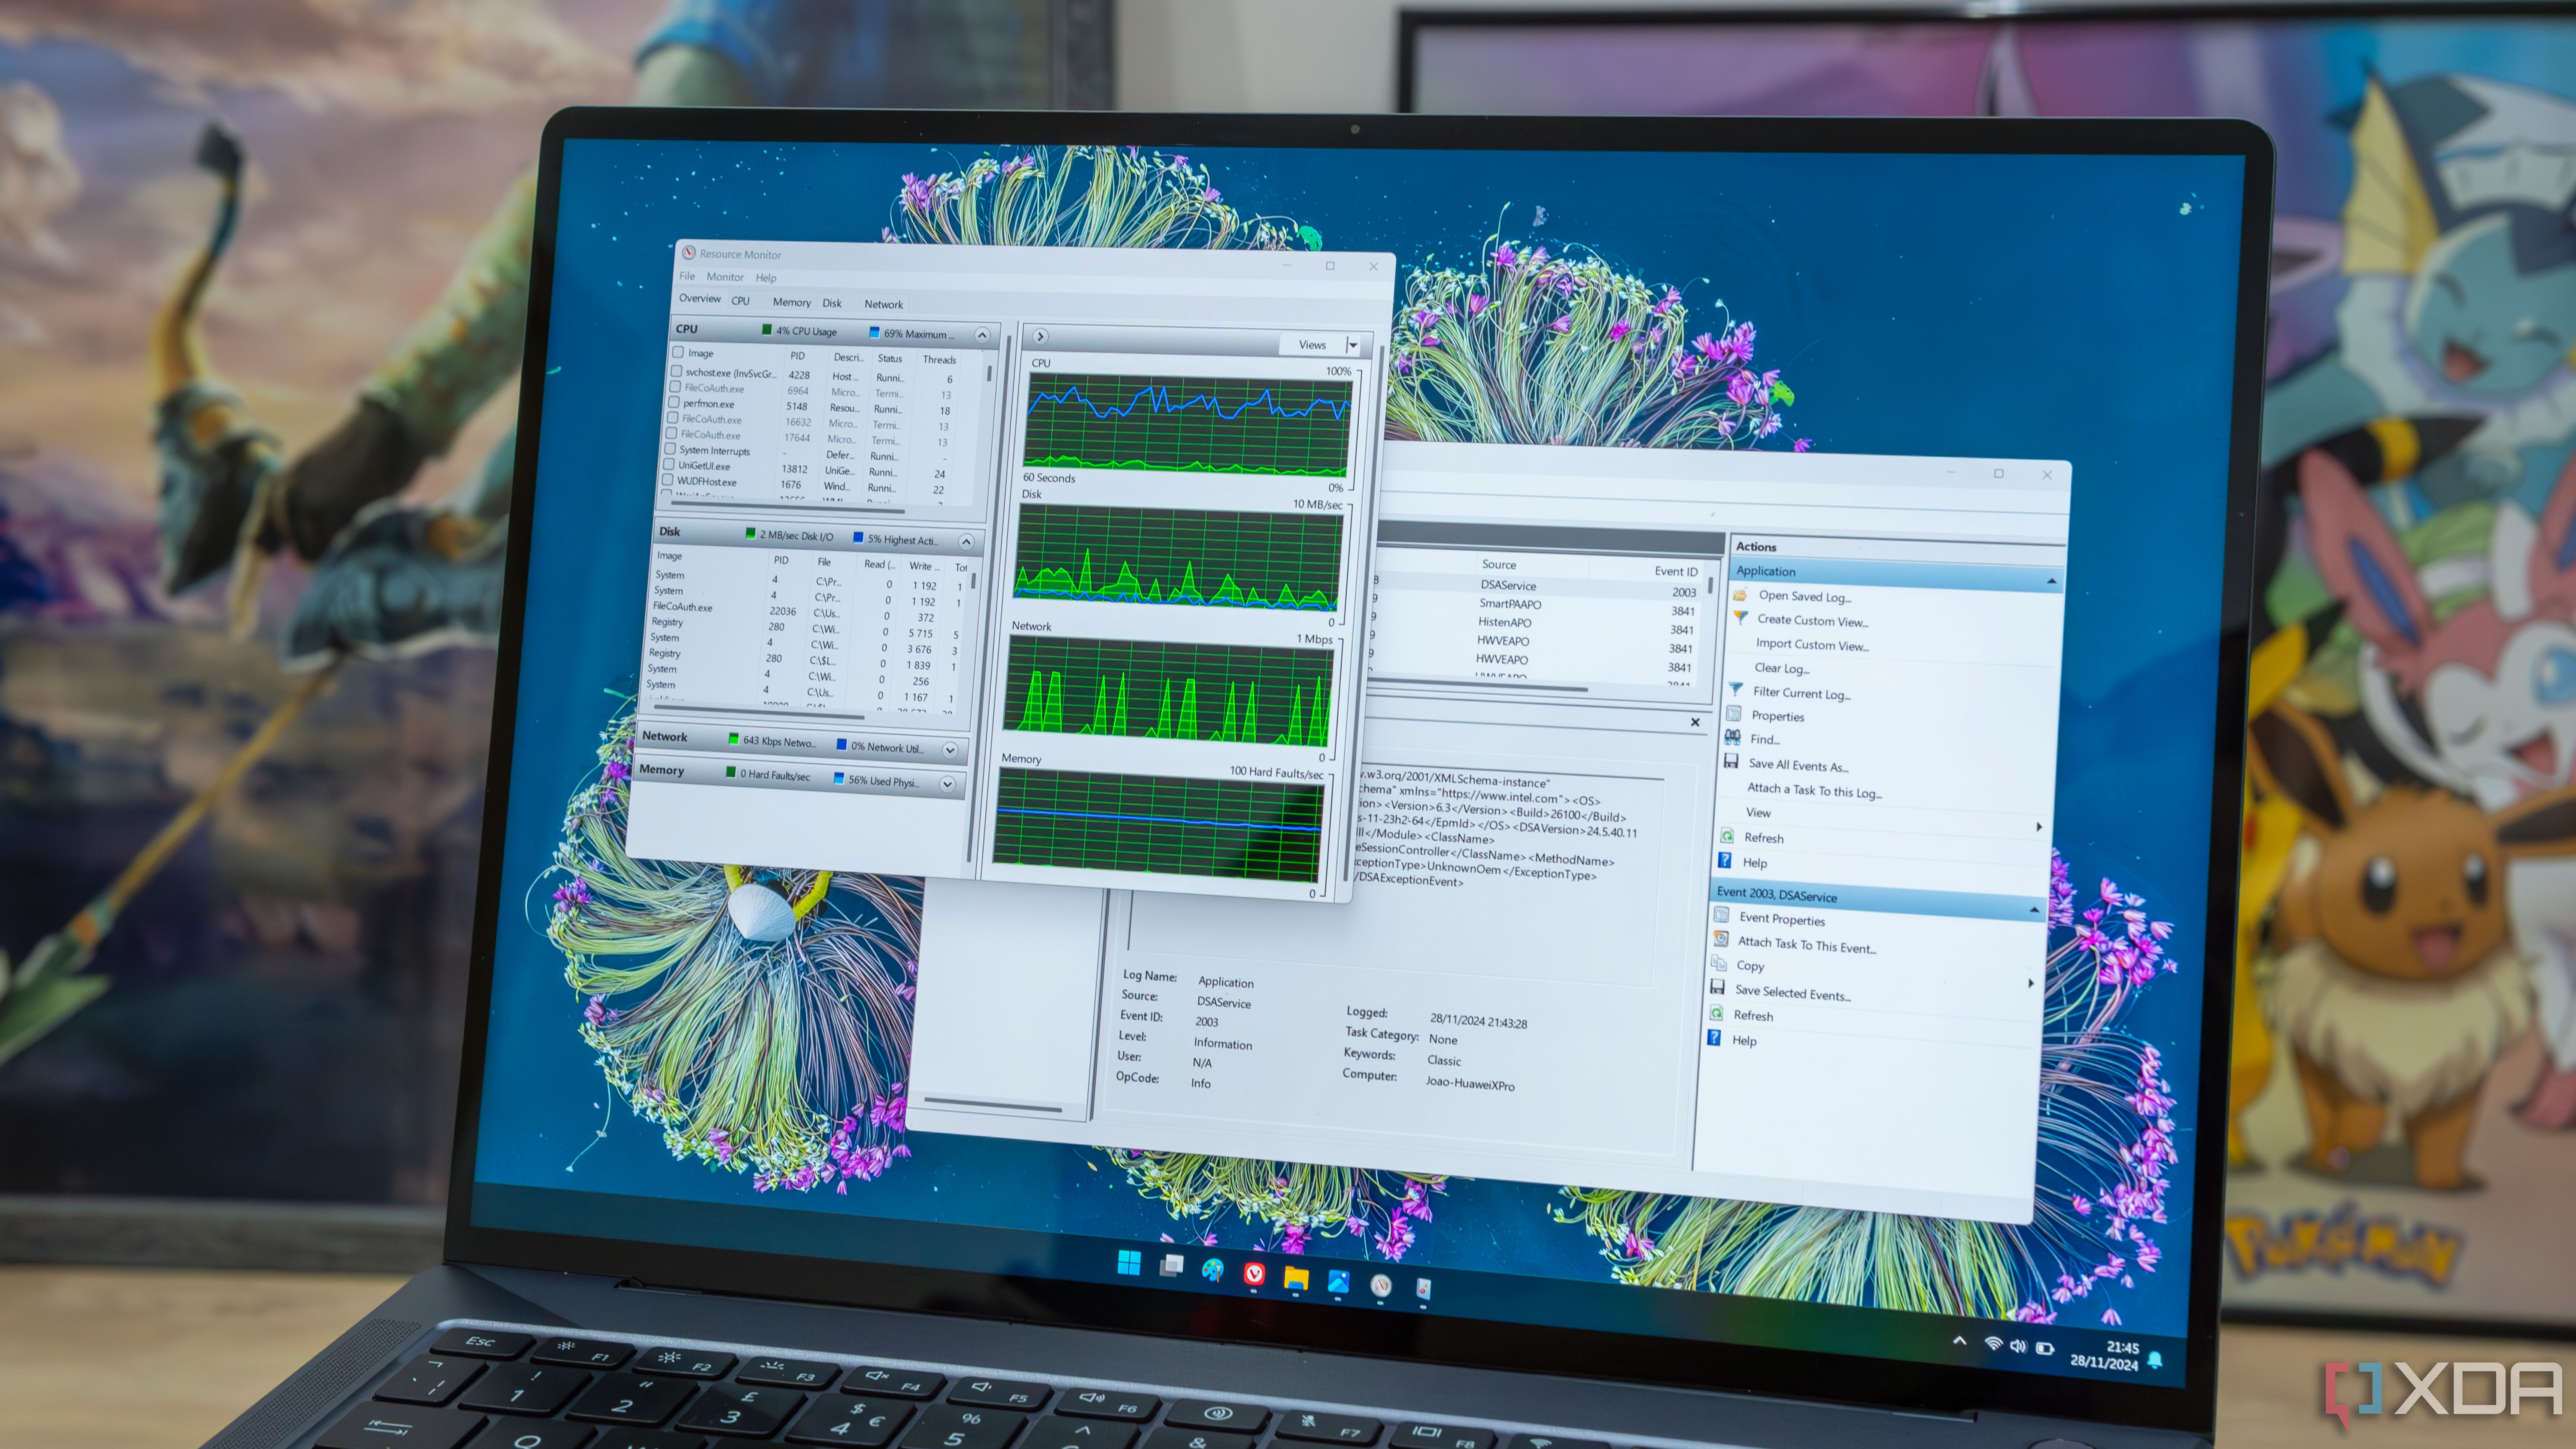
The live performance metrics are certainly interesting to look at, but Performance Monitor also has a cool feature in its ability to generate reports based on certain data collector sets. The system comes with two predefined Data Collector Sets, and you can run them to begin collecting data within that set for the specific period of time (60 seconds).
The reports generated from these data collection sessions are incredibly detailed and allow you to see things such as the number of processor interrupts per core, CPU usage time (also broken down per core), and much more. You can also run system diagnostics to see if there are any errors found in your software and hardware configuration.
But you might not always need all that information, so Performance Monitor makes this even better by allowing you to create custom data collection sets, too. You can create logs based on performance counter data, event trace data, and system configuration information, and combine all the specific bits of information you want to know about, without including things you don't need. You can further customize these sets to then run the data collection for a shorter or longer period so you can get a better look at the information you need over time.
Related
I'm using these open-source resource management tools to monitor my Windows 11 resources
Is your system running smoothly? Try monitoring its hardware and performance with these open-source tools
Performance Monitor is an amazing tool for pros
All things considered, Performance Monitor is one of the most in-depth tools you could ask for when it comes to managing your system's performance. With so many little details to dive into, you can truly stay on top of your system's resources and ensure things are running smoothly the way they were intended.
If you're curious to check it out, simply open the Start menu on your PC and search for Performance Monitor, or press Windows + R on your keyboard and then type in perfmon, then press Enter. From there, iyou have free range to explore all the available options to get the information you need.


 English (US) ·