.png)
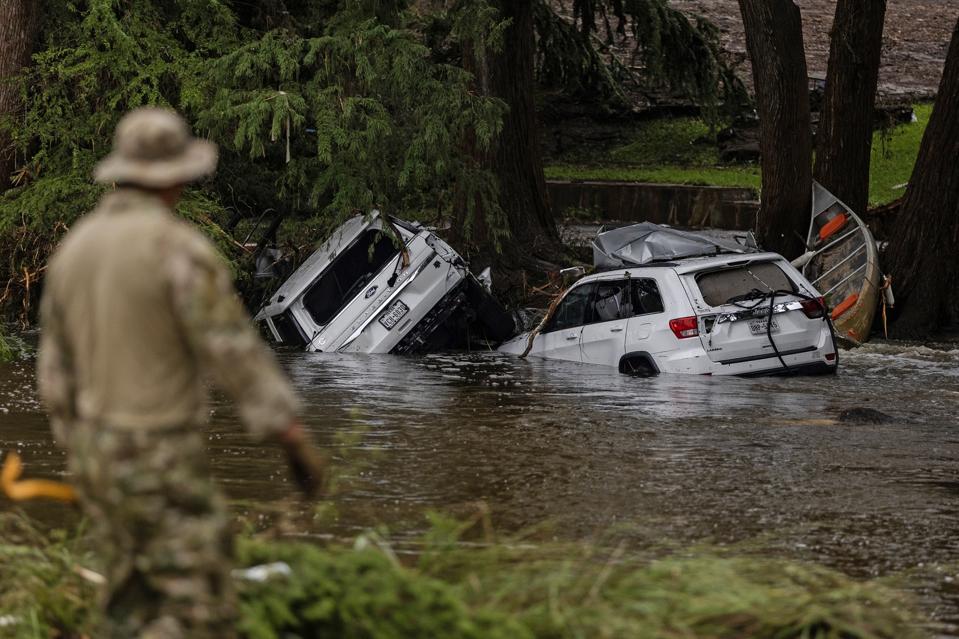
HUNT, TEXAS - JULY 6: Vehicles sit submerged as a search and rescue worker looks through debris for ... More any survivors or remains of people swept up in the flash flooding on July 6, 2025 in Hunt, Texas. Heavy rainfall caused flooding along the Guadalupe River in central Texas with multiple fatalities reported. (Photo by Jim Vondruska/Getty Images)
Getty ImagesTexas is still grappling with one of the worst flood disasters in U.S. history, and at the time of writing, another round of extreme rainfall is affecting the Hill Country. The death toll is approaching 130, and nearly 170 people are still missing. Historically, a weather disaster of this magnitude prompts discussion, policy changes, and reflection. Adequate, timely weather warnings were issued in the days and hours leading up to the flood catastrophe, but people still died. As former President of the American Meteorological Society and a scholar who studies extreme rainfall, I continue to ponder whether a category system, like the Saffir-Simpson Scale (hurricanes) or Enhanced Fujita Scale (tornadoes), would have prompted earlier and different actions in Texas (and elsewhere).
Scales Have Flaws
To be clear, I have argued in recent years that the Saffir-Simpson Scale used for hurricane risk communication has its flaws. It was designed as a wind scale and conveys very little direct information about inland flooding, storm surge, and tornado hazards associated with hurricanes. Studies have shown that water (storm surge and rain) are the deadliest aspect of hurricanes. Yet, people tend to fixate on the category. A study published by our research team at the University of Georgia found that the most prolific rain producers are tropical storms and weakening hurricanes. For example, high-impact rains associated with storms like Helene (2024) and Harvey (2017) were during post-hurricane phase. With hurricanes, I cringe when people say, “It’s just a tropical storm or Category 1 hurricane.” That statement undervalues the impact of rainfall, particularly if the storm slows down or stalls as we saw, for example, with Florence (2018) in the Carolinas.
LUMBERTON, NC - SEPTEMBER 20: Propane tanks are seen in the flood waters after heavy rains from ... More Hurricane Florence inundated the area on September 20, 2018 in Lumberton, North Carolina. Residents have begun cleaning up in North Carolina as the flooding has begun to subside. (Photo by Joe Raedle/Getty Images)
Getty ImagesEven With Flaws, Is There Opportunity With Flood Risk Communication?
That’s a long-winded way of saying that planning for impacts is more important than categorization. However, there is no doubt that hurricane categories get the attention of the media, public, and decisionmakers. In the July 4th Texas Floods, the weather warnings were there. As early as four days before the event, NOAA identified the region in its 3 to 7-day hazards outlook for heavy rainfall. Let’s pause right there and consider a hypothetical scenario. If a Category 5 hurricane was forecasted to make landfall in 3 to 4 days, what do you think would be happening in threatened jurisdictions? My experience tells me that evacuation planning, infrastructure preparations, and the media onslaught would be in full swing.
Day 3 to 7 Hazard Outlook issued on June 30th identified heavy rainfall potential in Texas Hill ... More Country for July 3, 2025.
NOAAWhat if we had a category or index system that classified the rainfall in situations like the Texas Hill Country floods? People often tell me they cannot discern an extreme flood threat from more common floods. They complain that about saturation of information. If you live in the “flash flood alley” of Texas, it is likely that flash flood watches and warnings are common. Let’s review the weather warning timelines for the Texas flooding on July 4th:
- Day 3 to 7 Hazard Outlook issued on June 30, 2025 identified heavy rainfall potential in Texas Hill Country for July 3, 2025.
- Flash Flood Watch issued at 1:18 pm Thursday July 3.
- Flash Flood Warning issued at 1:14 am Friday July 4. Emergency alert system pushes information out to phones.
- Flash Flood Emergency issued at 4:03 am Friday July 4. Emergency alert system pushes information out to phones.
There is a wide variety of flood products and warning messaging.
NWSIn those warnings words like “life-threatening” and “flash flood emergency” were conveyed. NWS did its job. However, the vast area of communication tools and texts may not always resonate with the broader public. One person asked me why don’t they just use words with more direct, personal urgency like “Get to high ground now or you will die!” Over the years, I have seen messaging with hurricanes or tornadoes use such language. We have cute little slogans like “turn around, don’t drown” for conveying some aspects of flood risks, yet I constantly see videos of stranded cars on flooded roadways. To be fair, the NWS is aware of such challenges and have implemented a program to simplify hazard messaging.
KERRVILLE, TEXAS - JULY 04: Kerrville resident Leighton Sterling watches flood waters along the ... More Guadalupe River on July 4, 2025 in Kerrville, Texas. Heavy rainfall caused flooding along the Guadalupe River in central Texas with multiple fatalities reported. (Photo by Eric Vryn/Getty Images)
Getty ImagesWith the July 4th Floods, there was time in the hours leading up to the rapid rise of the river (~3:00 am) and record crest of the Guadalupe River (~5:10 am) for an array of responses. However, let’s move the discussion away from the hours leading up to the event. What about the days leading up to the event? There were clearly signals that prompted National Weather Service meteorologists to identify that region in the 3 to 7-day hazards outlook on June 30. Enough information was in place to warrant a Flash Flood Watch the day before.
The Flash Flood Severity Index
What happens if these signals were wrapped up in a “category” and communicated in that way? Even with flaws, emergency managers and the public are conditioned to understand or react to high numbers on scales. In fact, a 2024 study by researchers at the University of South Florida found that not only are people cognizant of the Saffir-Simpson Scale, they are aware of its deficiencies at capturing the full spectrum of risk from rainfall, surge, and so forth. The study recommended audience-centered communication strategies that might include separate rating systems, accessible visuals, personalized information delivery, and tailored messaging for varying levels of risk perception.
Meteorologist Hugh Johnson points to the forecast cone of Hurricane Sandy on a computer map at the ... More National Weather Service on Fuller Rd. on Thursday, Oct. 25, 2012 in Albany, N.Y. This is the predicted path zone for the hurricane as of the time this photo was taken. (Photo by Lori Van Buren/Albany Times Union via Getty Images)
Albany Times Union via Getty ImaA 2018 study published in Natural Hazards found that people generally want information about how flooding might occur and when it will happen so that they can understand and process their risk level or decision options. A 2021 study in China revealed that over half the respondents in their survey either underestimated flood risks or had flawed perceptions about them. In Texas Hill Country or other rain-prone regions, normalcy bias narratives that “we get lots of rain all of the time” can further complicate misperceptions or actions. That same study found that suburban and rural residents reported closer social communications with people in their community, which shaped behavior or attitudes towards flood warnings.
Could a flood index help with such misperceptions? We have known for decades that flooding and heat, for some people, do not illicit the same level of risk perception as tornadoes or hurricanes even though they are the two deadliest weather events each year in the U.S. One of my former doctoral students, Amanda Schroeder, came to me several years ago at the University of Georgia with questions about the feasibility of flood scale. Dr. Schroeder and a collective of scholars went on to publish an initial study of a Flash Flood Severity Index in 2016. Yes, one exists. The index has five impact-based categories (Category 1, very minor flooding to Category 5, catastrophic flooding). Just two months ago, Schroeder and a team of NWS colleagues outlined in the Bulletin of the American Meteorological Society extensive field testing of FFSI since 2018.
BEAR CREEK, USA - JULY 8: A view of destruction on a road to Chatham Central High School following ... More the tropical storm Chantal in Bear Creek North Carolina, United States on July 8, 2025. After the storm weakens National Hurricane Center to downgrade it to a tropical depression. (Photo by Peter Zay/Anadolu via Getty Images)
Anadolu via Getty ImagesThe FFSI is a damage-based, post-event assessment like the Enhanced Fujita Scale rating designated after tornadic events. However, I think there is still value in the index. The Texas Hill Country flooding on July 4th was certainly a Category 5. Thanks to the EF scale, people have a keen sense of what damage from an EF-5 tornado looks like. The FFSI could help shape flood literacy and build mental models of what flood risk levels look like, especially if warnings said things like “potential Category 5 flooding” is possible. The challenge, like with any scale, would be finding the right cadence and usage for the most extreme categories. That’s where research comes in.
The deadliest weather in the U.S.
NWS


 English (US) ·