.png)
It's no secret. I've been tinkering with my NAS and installing self-hosted apps, running Docker containers, and more for years. However, one thing I never bothered to do was set up an uptime monitoring dashboard. It felt a bit unnecessary. When I did look into it, most guides pointed me towards Grafana or Prometheus, which require too much work for my simple needs. The reality is that I just wanted a quick way to glance at my system and know what was going on. That's it. Nothing fancy or requiring too much configuration.
That's where Beszel steps in. I've only come across the app recently, but it's already made me wonder why I didn't install it earlier. The lightweight monitoring dashboard spins up in minutes, doesn't really need any configuration, and gives you quick insights into your system's uptime and system stats with an easy-to-glance dashboard. Here's why I recommend it to everyone.
Features that make Beszel stand out
A clean dashboard that works out of the box
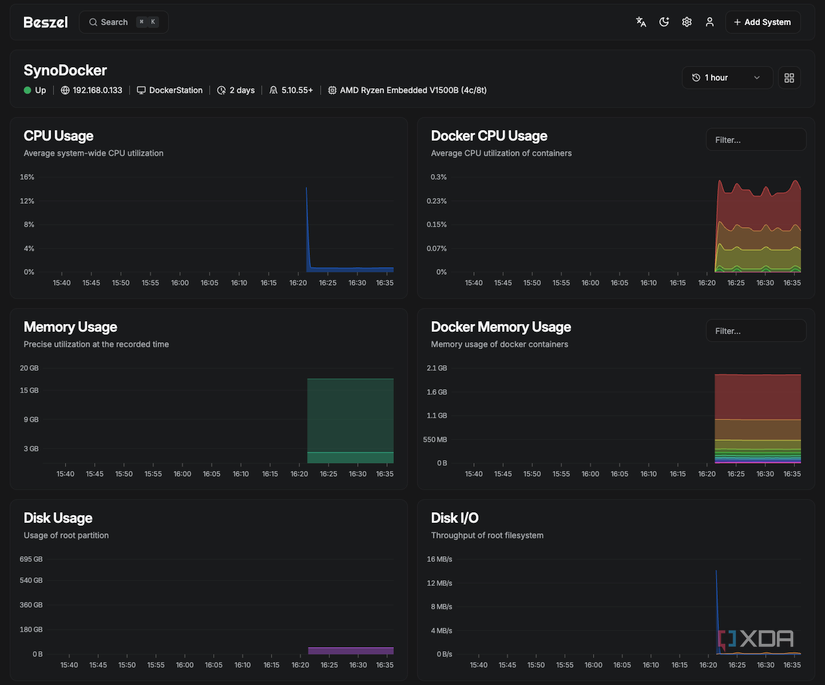
The first thing that stood out to me about Beszel was how frictionless the setup is. Just use the provided Docker Compose file and you're good to go. When you first tap the add system button within Beszel, it'll provide you with a key and token that you'll need to add to your Docker Compose file, and that's it. It'll automatically pull down the CPU, RAM, storage, and network usage charts. If the goal was to give you all the vital stats immediately, Beszel manages that with ease. Moreover, there's multi-system support, so you can monitor multiple servers from a single dashboard without requiring you to switch tabs.
Beszel's clean design is one of the features that stand out. The homepage presents a minimal number of essential metrics, including CPU usage, memory consumption, internet bandwidth usage, and, of course, system temperature. These give you a real-time overview that focuses on essentials. From there, tapping the server lets you dig in deeper if you want. Usually, this page is all I need running in the background to keep tabs on my home servers.
Another small but very cool feature of Beszel is its integration with Docker. While it won't give you granular insights on each Docker container on your network, it will show you how much memory and CPU percentage is being used by Docker as a whole. Additionally, you can see resource utilization for individual Docker containers. That's a handy feature to have for someone like me who regularly spins up Docker containers and then has to worry about which container is hogging the CPU or leaking memory.
It's simple and straightforward, exactly what I need and want from a monitoring dashboard.
How to install and set up Beszel
Installing Beszel is faster than you think
Alright, here's the part that convinced me to finally give a monitoring dashboard a try. Installing Beszel takes minutes at best, and most of that is waiting for Docker to pull the image. Once the container is up, just point your browser to your server's IP address and the default 8090 port, unless you've swapped it out for another. Create an admin account and you're done. That's it. There's no long setup wizard here. In fact, the only configuration you'll need to do is to add the key and token to your Docker Compose file, as I mentioned earlier. Within seconds, your server will start reporting in the dashboard.
I've already found having a dashboard handy in ways that I didn't anticipate. For example, just the other day, I observed Plex misbehaving, and I was quickly able to spot a spike in CPU usage. It turns out that it was a spike in friends trying to transcode video instead of directly streaming it. Similarly, I use the dashboard to keep tabs on my server's temperatures when I observe the fans starting to spin up a bit too often. Basically, the dashboard gives you the tools to diagnose what's happening on your server without any of the guesswork. If you are running more than one server, the benefits get multiplied.
The simplest monitoring dashboard for your NAS
I'll be honest, I wish I'd installed Beszel on day one when I started using my NAS as more than a simple storage device. It would have saved me hours of hunting through logs and fumbling about, figuring out what had got my NAS running hot. I've tried other dashboards before, but I've given up because of the time commitment required to configure them. Beszel stands out because it's not trying to be the most advanced all-in-one tool around. Which, I suppose, is also why it works so well.
If you are running a home server on dedicated hardware, a NAS, or even a Raspberry Pi, installing Beszel makes a lot of sense. It takes minutes to set up, has a negligible learning curve, and gives you a dashboard that you'll actually use instead of one that you only tap into when something breaks. If you are still searching for a monitoring dashboard, do yourself a favor and try this one first. I doubt you'll need anything else.
Beszel is a self-hosted uptime monitoring service that can be installed via Docker. The service lets you track system uptime as well as CPU, memory and network usage. It can also be used to track temperature levels across multiple servers.


 English (US) ·